Keith Weiner
My articles My offerMy siteAbout meMy videosMy books
Follow on:LinkedINTwitterSeeking AlphaFacebookAmazonGoogle +
See the introduction and the video for the terms gold basis, co-basis, backwardation and contango.
Small Crowds, Shrinking PremiumsThe prices of gold and silver rose five bucks and 37 cents respectively last week. Is this the blast off to da moon for the silver rocket of halcyon days, in other words 2010-2011? We will look at the basis signals in a bit. But for now, we want to comment on the absolutely moribund state of the retail market. Coin and bar premiums are near or at long-term lows. That means buyers are not necessarily buying new product from the mints, but rather there is plenty of “used” product floating around the market from other retail customers who are selling. |
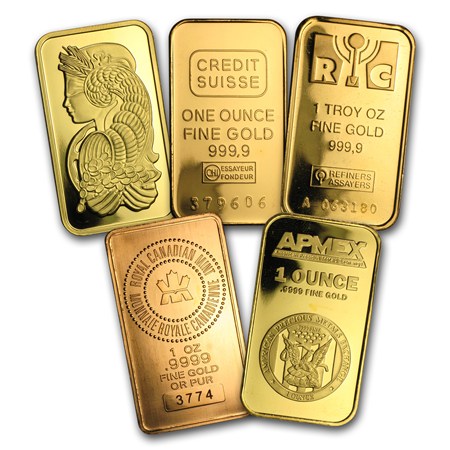 Various gold bars. Coin and bar premiums have been shrinking steadily (as have coin sales of the US Mint by the way), a sign that retail investors have lost interest in gold. There are even more signs of this actually, and this loss of interest stands in stark contrast to the firm gold price. Of course, retail investors have generally very little influence on the gold price anyway – they only serve as a contrary indicator. [PT] |
| Every dealer we talk to acknowledges volume is down too. So not only is there less revenue, but the margin on that revenue is smaller. I am here in San Antonio for the International Precious Metals Institute conference, and though it is my first time attendees keep saying it is a smaller crowd.
This is not an environment for a Lift Off Event. It is not bullish, except in the way that before the bull market often must come capitulation. This smells like retail capitulation. |
Cash Gold, Spot Gold 2004-2018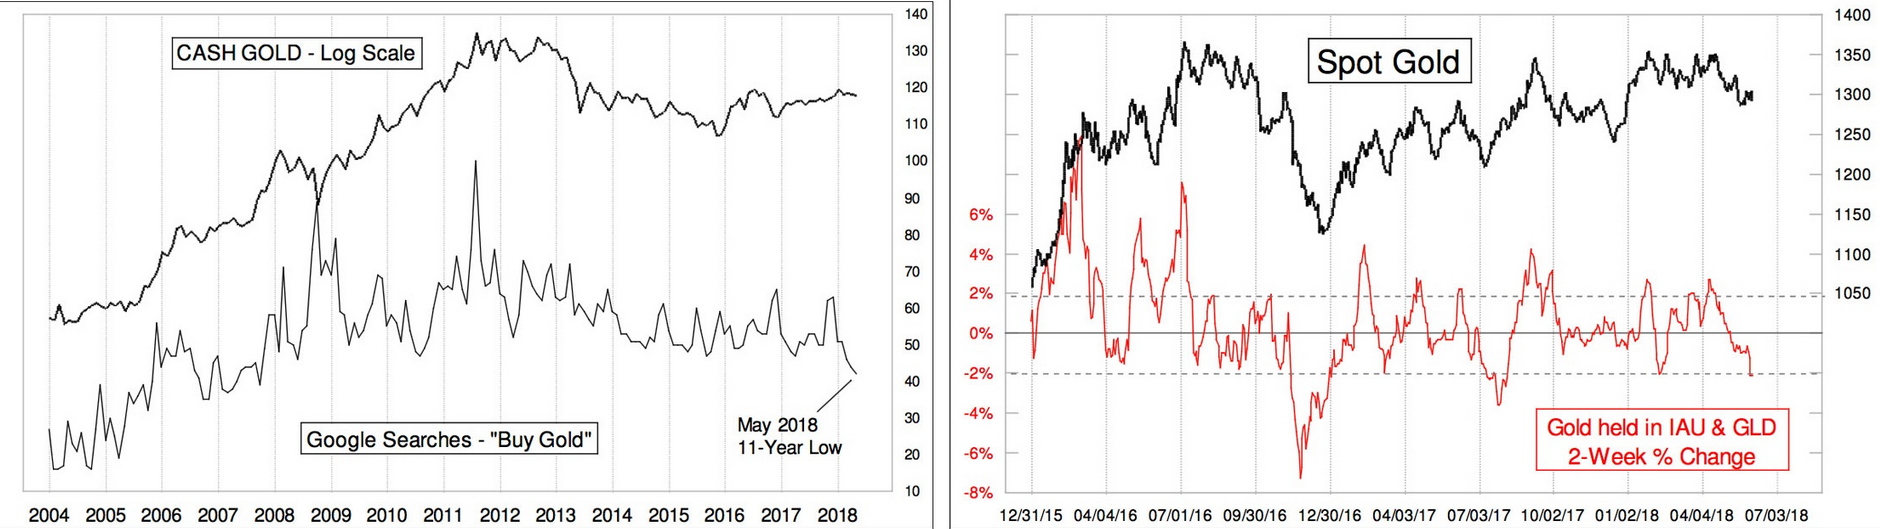 - Click to enlarge Here are two charts shown in a recent Tom McClellan market report. They also illustrate “retail capitulation”, or rather “disinterest”, which from a contrarian perspective is even better in our experience. The chart to the left shows that Google searches on “buy gold” have recently declined to an 11-year low; the chart to the right shows the 2-week percentage change in gold held in the open-ended bullion ETFs GLD and IAU. Whether these ETFs create new share baskets and buy gold, or dissolve existing share baskets and sell gold depends on whether or they trade at a premium or a discount to NAV. Authorized participants then engage in arbitrage deals. When the ETFs accumulate gold it is a sign of strong buying interest pushing them to premiums to NAV in intraday trading – which then is arbitraged away by the creation of new share baskets. What makes this chart especially interesting in our opinion is the strong and recently growing divergence between the gold price in the action in the ETFs, with the former holding up quite well in the face of retail disinterest. This too is a bullish contrarian signal. [PT] |
Fundamental DevelopmentsBelow is the only true picture of the gold and silver fundamentals. But first, here is the chart of the prices of gold and silver.
|
Gold and Silver Prices(see more posts on gold price, silver price, )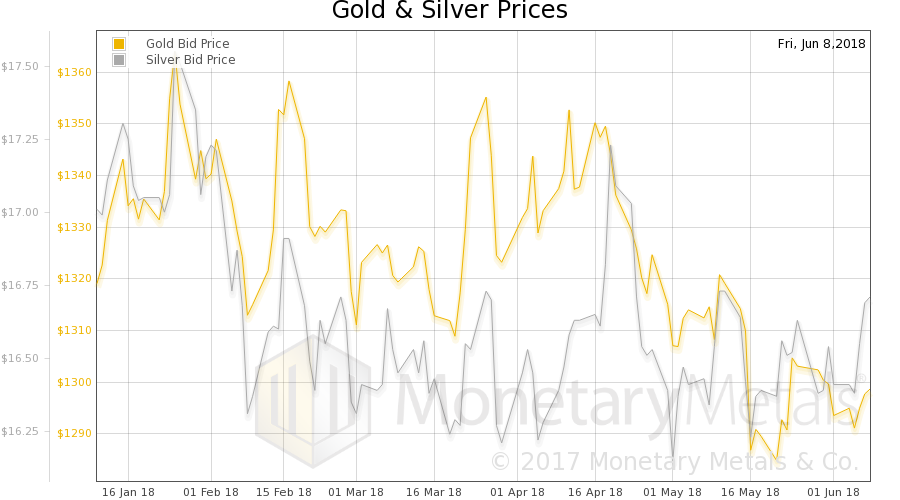 Gold and silver prices in USD - Click to enlarge |
Gold:Silver RatioNext, this is a graph of the gold price measured in silver, otherwise known as the gold to silver ratio (see here for an explanation of bid and offer prices for the ratio). It fell this week. |
Gold: Silver Ratio(see more posts on gold silver ratio, )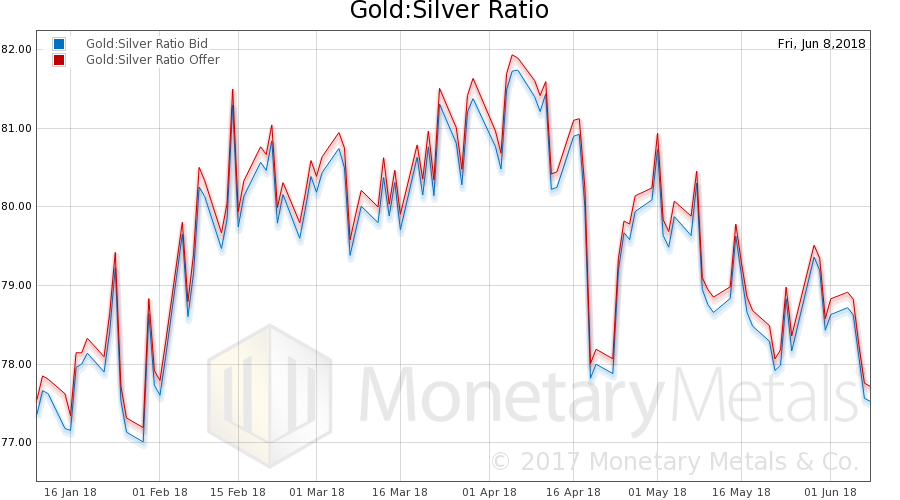 Gold-silver ratio, bid and offer - Click to enlarge |
Gold Basis and Co-basis and the Dollar PriceHere is the gold graph showing gold basis, co-basis and the price of the dollar in terms of gold price. The price of gold rose (which is really the falling price of the dollar, shown in green). As the price rose, the scarcity fell (i.e., the co-basis, the red line). Nothing unusual about this. |
Gold Basis and Co-basis and the Dollar Price(see more posts on dollar price, gold basis, Gold co-basis, )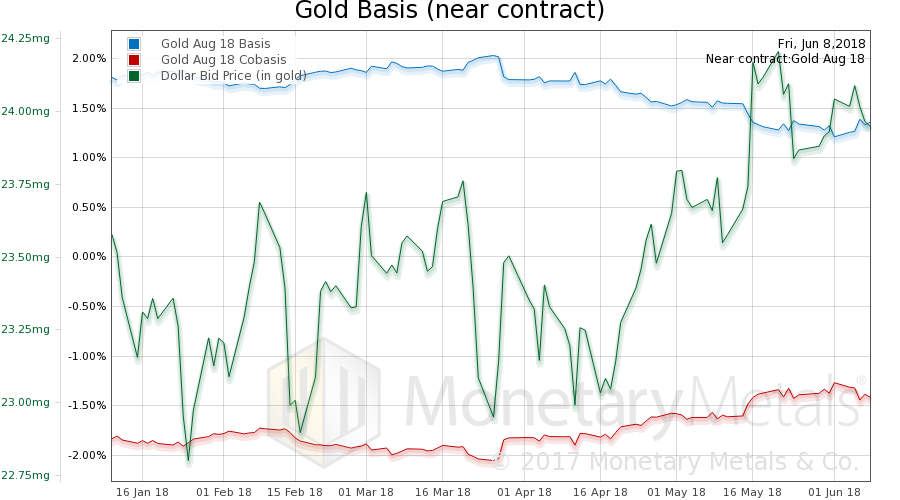 Gold basis, co-basis and the USD priced in milligrams of gold - Click to enlarge |
Gold Fundamental PriceThe Monetary Metals Gold Fundamental Price fell $35 this week to $1,351. The fundamental price has almost completed a full round trip, as it went above (way above) its long-term range and is now falling back into it. Here is a graph showing the fundamental price for the last 3 years. |
Gold Fundamental Price(see more posts on gold price, )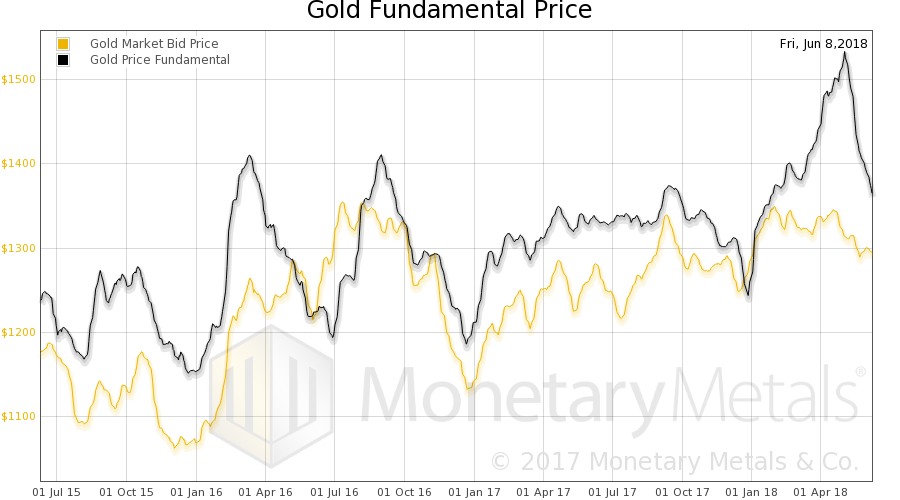 Gold – theoretical fundamental price vs. market price. Note: on several past occasions (see e.g. early 2016 on this chart) spikes in the fundamental price have led the market price. [PT] - Click to enlarge |
Silver Basis and Co-basis and the Dollar PriceNow let’s look at silver. The July silver co-basis fell from -0.4% to -1.2%. The price of silver rose a lot more than that of gold. The silver basis continuous shows a much smaller move. It’s a little odd, as we are now well into the time when futures speculators are rolling their July contracts to September. This should be pushing the contract price down, which pushes the co-basis up. We normally see temporary backwardation as contract expiry approaches. Last week the move in the silver co-basis went opposite to this. Obviously, much of the buying in silver was in futures, and most of that was in the July contract. Why would a speculator buy a July contract, that he would only have to roll in a few weeks? Perhaps he is not thinking of holding that long? We don’t know, we are guessing. |
Silver Basis and Co-basis and the Dollar Price(see more posts on dollar price, silver basis, Silver co-basis, )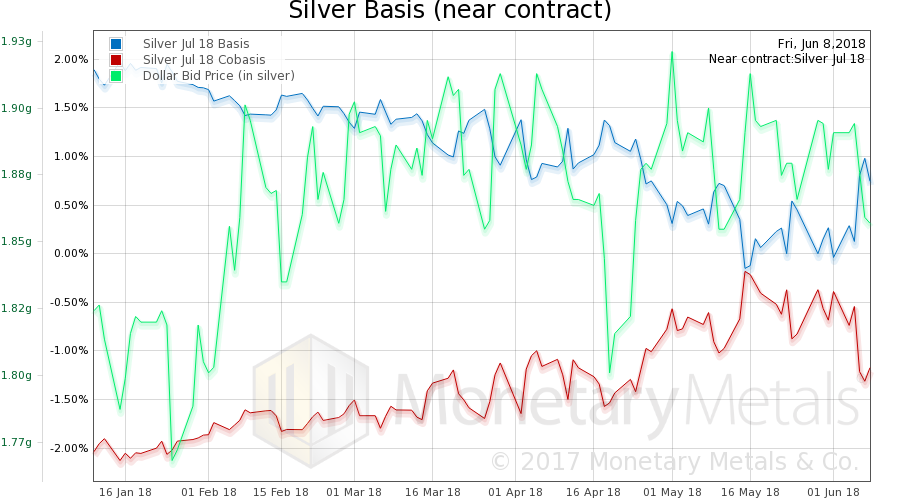 Silver basis, co-basis and the USD priced in grams of silver - Click to enlarge |
The Monetary Metals Silver Fundamental Price fell 38 cents to $17.13.
© 2018 Monetary Metals
Charts by Tom McCellan, Monetary Metals
Chart and image captions by PT
Full story here Are you the author?Tags: Chart Update,commodities,Crude Oil,dollar price,gold basis,Gold co-basis,gold price,gold silver ratio,newslettersent,Precious Metals,silver basis,Silver co-basis,silver price