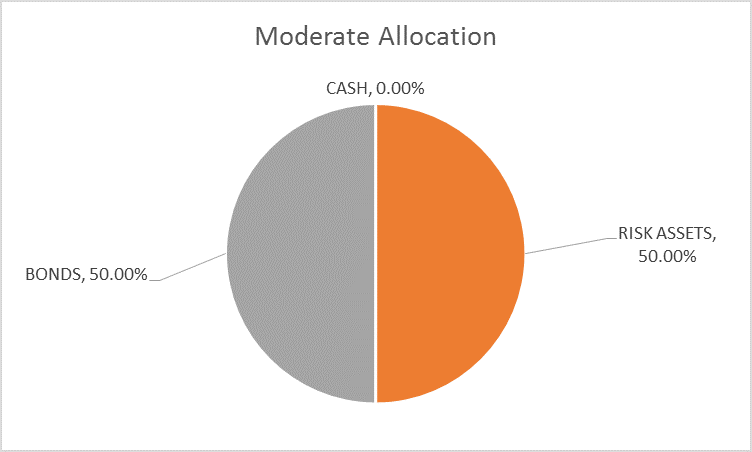
The risk budget is unchanged this month. For the moderate risk investor the allocation to bonds and risk assets is evenly split. There are changes this month within the asset classes.
How far are we from the end of this cycle? When will the next recession arrive and more importantly when will stocks and other markets start to anticipate a slowdown? These are critical questions for investors and ones that can’t be answered with a high degree of certainty. History may not repeat but is said to rhyme so probably the best we can do is look to the past for a clue about the future.
The yield curve is often cited as the best recession indicator and we agree with that assessment. But it is easy to misinterpret and most people do. Everyone knows the yield curve inverts prior to recession – or at least it has for a long time – but the lag time can be considerable. In the last cycle the 10/2 curve first inverted in February of 2006 a full 18 months prior to the official onset of recession. The S&P 500 still had 21% more upside at that point. In the 90s the curve first inverted in June of 1998, almost three years – and over 30% in gains for the S&P 500 – before recession.
While an inversion of the yield curve is important it isn’t the signal for recession. The more timely indication is a steepening of the yield curve known, ironically, as a bull steepener. That occurs when short term rates fall faster than long term rates. This situation generally reflects an expectation that the Fed will cut short term rates. In the last cycle, the maximum inversion came in November of 2006 and the curve turned positive for good in June of 2007, just 5 months before recession. The Fed’s first rate cut came in August of the same year.
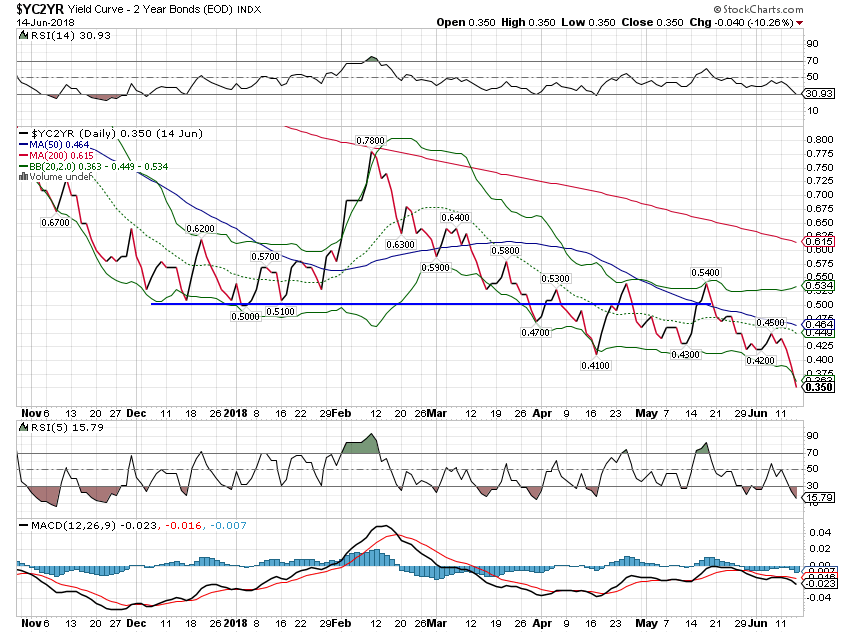
Of course, we aren’t even close to that circumstance presently. The fed is widely expected to hike rates two more times this year and the 10/2 curve is at 35 basis points and falling. The comparable period in the last cycle was in the summer of 2005 over two years prior to recession. All cycles aren’t the same obviously and the 1990s business cycle saw the curve at present levels as early as December of 1994, over six years before recession. So we may be two years before the next recession but that is in no way a prediction. As I’ve said many times, I can’t predict the future and the present isn’t as easy to interpret as most people seem to think.
Assuming that the curve will invert prior to the next recession and that the time line for this inversion is similar to the last cycle involves way too many assumptions for my taste. The yield curve does not have to invert prior to recession; this isn’t science which sets out hard and fast rules. We don’t even know if the curve will steepen prior to recession. Long rates and short rates could fall at the same rate which might tell us an even worse story than a mere recession.
Luckily, we don’t need to predict the exact onset of the next recession. In the last cycle stock prices within 10% of the ultimate monthly closing high were available from November 2006 to May 2008. In other words, you had an 18 month window within which you could have exited the market within 10% of the high. Precision was not required.
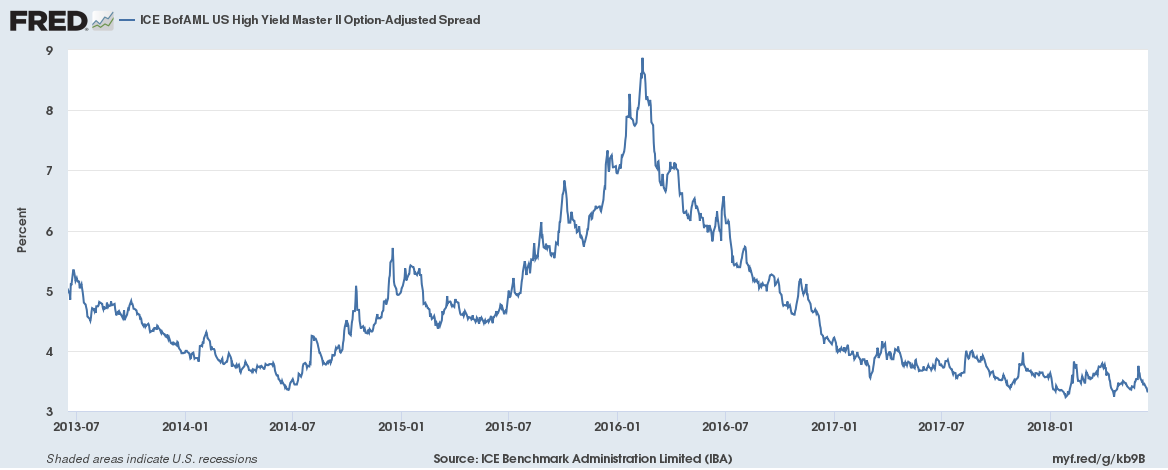
Right now the yield curve is not acting in any way like a recession is on the horizon. Neither is our other major indicator, credit spreads. That doesn’t necessarily mean that stocks will go up from here and it doesn’t rule out a bear market either. There have been bear markets without a recession although that is rare. But recessions without bear markets? That is even more rare and not worth hoping for.
| The only real justification for selling stocks at this point is valuation and that has been true for several years. Recession is not an imminent risk. There are, of course, political risks such as the ongoing trade negotiations but if those are a real risk they should show up as reduced growth expectations. While we have had some volatility during the back and forth between the US and its trading partners, we haven’t seen any change in growth expectations…yet. But an all out trade war would not be good for growth, domestic or global. So far the market seems to think the worst will be avoided and I tend to agree. President Trump wants to go into the mid-term elections with a win on trade and that means getting some concessions and making a deal before November. Is Trump the negotiator he thinks he is? We’re about to find out. | |
Yield Curve/RatesThe yield curve continues to flatten and the last hike by the Fed seems to have accelerated the process. At 35 basis points, we aren’t flat yet and certainly not inverted. For comparison purposes one might consider that this curve hit 35 basis points in the last cycle in June of 2005, over two years prior to the onset of recession. No, I’m not saying this time will be exactly like last time so that isn’t a prediction of the onset of the next recession. If anything, we should consider the fact that this cycle has been much more extended than the last one. There is a chance that we are further away from recession than the last time the curve flattened to this level. |
Yield Curve/Rates |
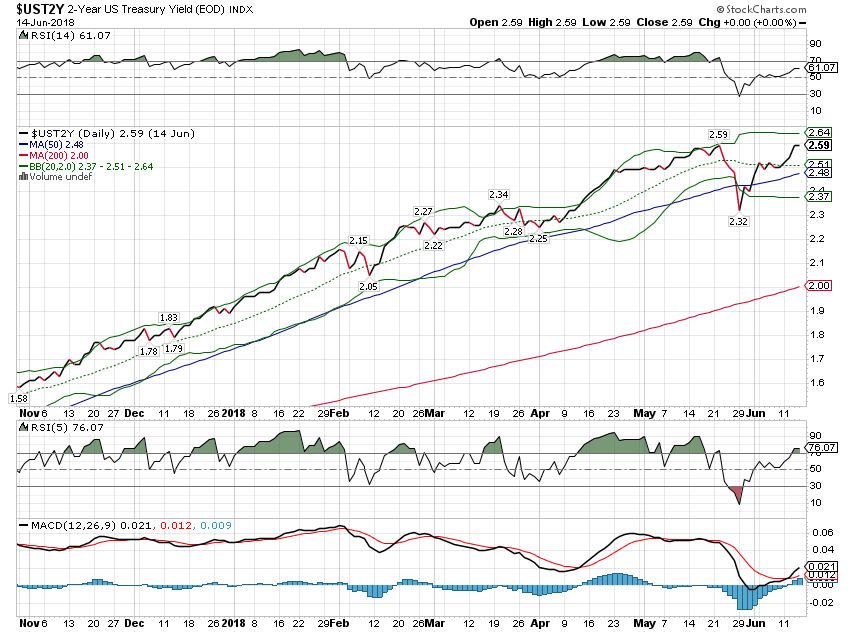
| How fast will the curve flatten? The answer to that question is probably tied to how fast the two year note yield rises. Considering how the Powell press conference was widely considered to be hawkish it is interesting that the two year yield seems to have stalled a bit recently. Adding another interesting note to the mix is the fact that the large short position speculators had held in the two year note has been covered. Speculators are actually net long the two year note in the last report I saw which indicates that while the pundits may think the Fed is hawkish the market isn’t as convinced. |
2-Year US Treasury Yield(see more posts on U.S. Treasury, ) |
| 10 Year TIPs yields fell 8 basis points over the last month, a very slight moderation of real growth expectations. The yield is still near the high end of the range since 2013 however, so growth expectations are fairly stable. Real growth expectations are also very modest and have been for some time. Consider that prior to 2008, the 10 year TIPS yield rarely fell below 1.5%. Rates would have to nearly double just to get up the low end of the previous cycle. |
10-Year Treasury Inflation-Indexed Security 2013-2018 |
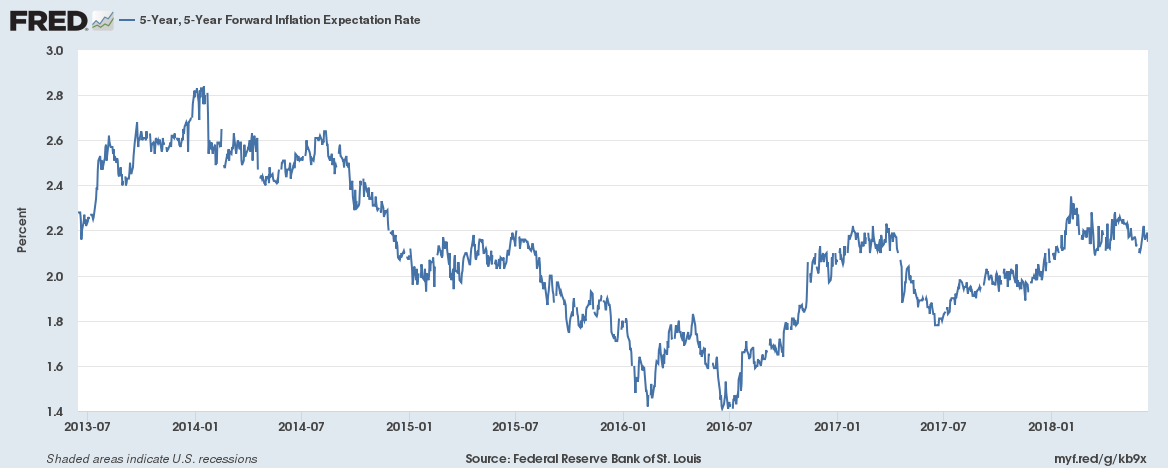
| Despite all the angst expressed by the pundits about inflation, longer term expectations have remained remarkably stable. This measure was unchanged over the last month. The 10 year breakeven rate actually fell a little since the last update. |
5-Year Forward Inflation Expectation Rate 2013-2018 |
Credit SpreadsCredit spreads spiked slightly and then fell back during the last month. Spreads are now very near the lows for this cycle. There is certainly no lack of demand for risky bonds. Just a reminder too that while this is near the low for this cycle, these spreads did go even lower in the last two cycles. So, yes, they can go lower and have in the past. |
US High Yield Master 2013-2018 |
Valuations
There just really isn’t any cheap place to hide in this market, at least not in the S&P 500. Every sector is trading at or near peak valuations depending on how you measure such things. About the only way you can make an argument for any sector or the market as a whole to be even fairly valued it to use forward estimates, a notoriously unreliable valuation method. In fact, I wouldn’t even call it a valuation method; I’d call it marketing. Foreign stocks are still the cheapest around and EM continues to be the cheapest of these. But you’ve had a demonstration over the last few months of what happens to those markets when the dollar rises and it isn’t pleasant.
While the US market as a whole is expensive, I would point out that I am still able to find attractive value situations in individual issues. In fact, in some ways, this market presents value opportunities on a regular basis since the algorithms don’t seem to have much in the way of judgment. Babies, bathwater and all that. In this market all earnings misses, all revenue misses, all negative changes in guidance are treated the same. And that creates opportunities even if just short term.
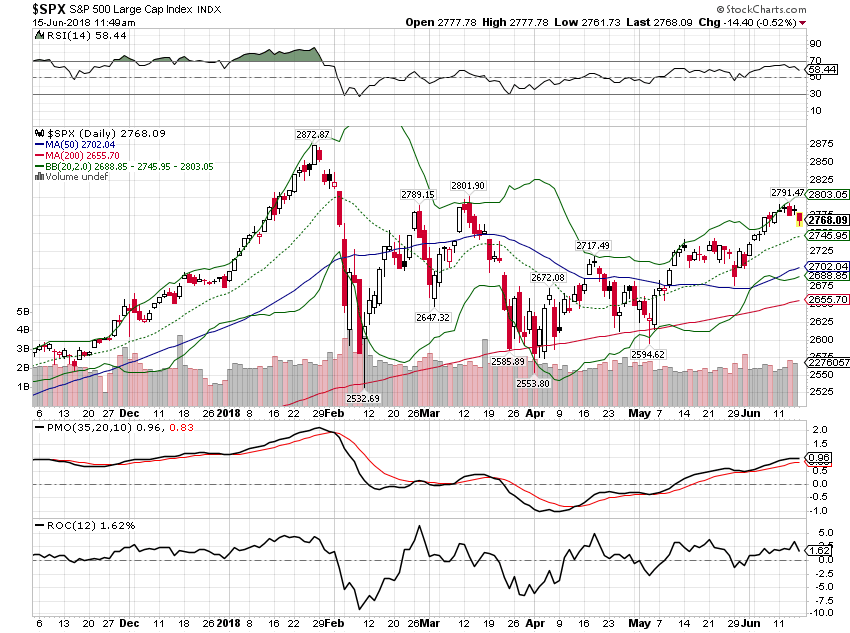
MomentumWe’ve had a little setback in recent days but momentum for US stocks is still positive in the short and long term. Of course, that could change quickly and usually does in a momentum driven market as we learned – or relearned or confirmed for us old-timers – in February. But for now, momentum is still favorable. |
S&P 500 Large Cap Index 2018(see more posts on S&P 500 Large Cap Index, ) |
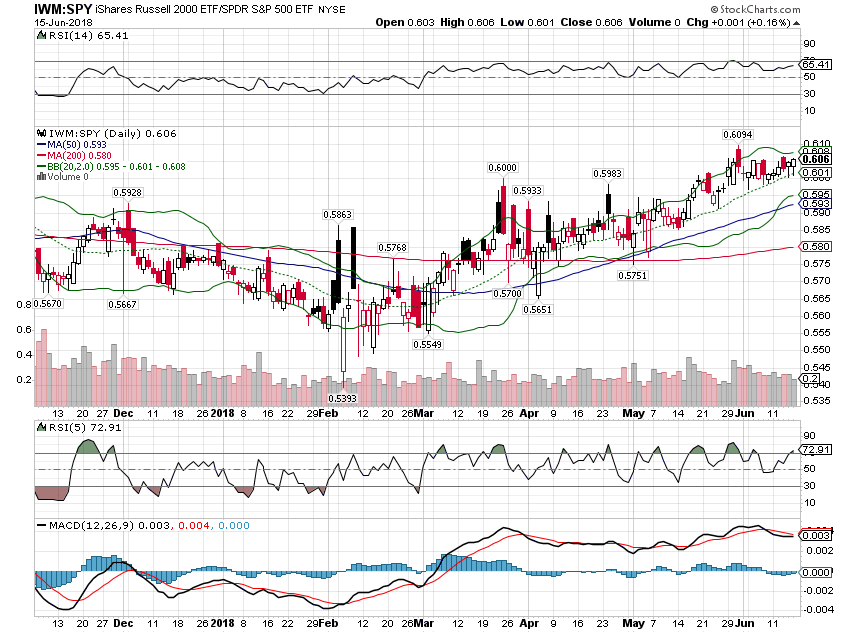
| Small cap stocks have been outperforming their larger cousins this year and it shows no sign of changing. |
iShares Russell 2000 ETF/SPDR S&P 500 ETF, 2018 |
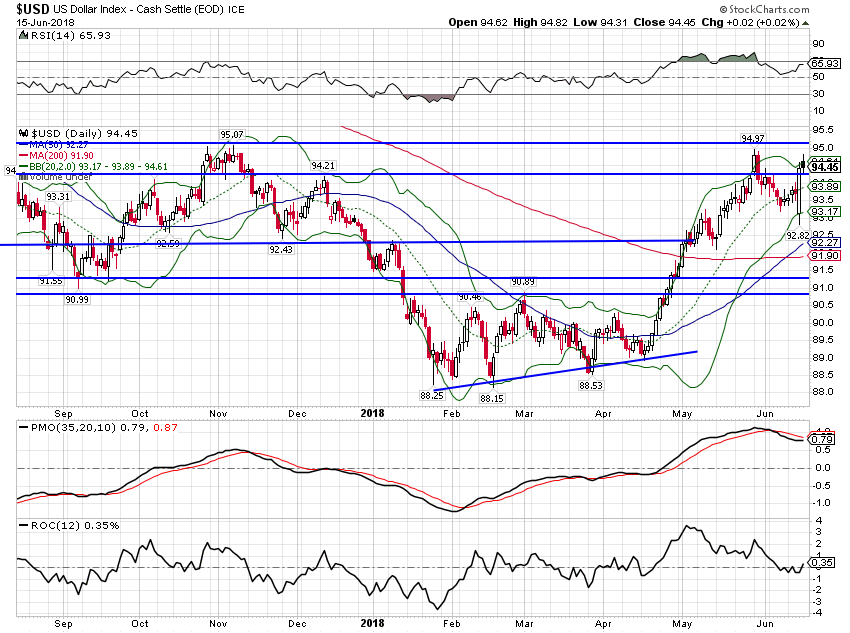
| The most interesting and volatile movement since last month is probably in currency markets. The dollar index is up over the last month by a couple of percent but that doesn’t capture the dramatics. The range on June 14th was nearly 2% on the day with most of the action coming versus the Euro as Mario Draghi said something markets hadn’t expected. The accepted narrative for the Euro drop that day was Draghi’s statement that even as QE ended, interest rates would likely remain at their current low levels until next summer. Apparently there were people in the market expecting Draghi to sprout wings and talons and turn into the hawk he’s never been. Another explanation might be the continued whispers that Merkel’s government in Germany is in trouble but so far that has all turned out to be nothing more than rumor. Whatever it was, that is a giant range for a currency in one day. Whether it means anything or not we’ll find out in coming days. Sentiment on the dollar had been pretty negative so this may be nothing more than short covering. |
US Dollar Index 2018(see more posts on US Dollar Index, ) |
| From a longer term perspective, the big one day move means very little. Monthly momentum still points south and as I’ve said many times, the President wants a weak dollar. One should probably not be surprised if he tweets or says something about the dollar very soon. |
US Dollar Index Monthly 1999-2018(see more posts on US Dollar Index, ) |
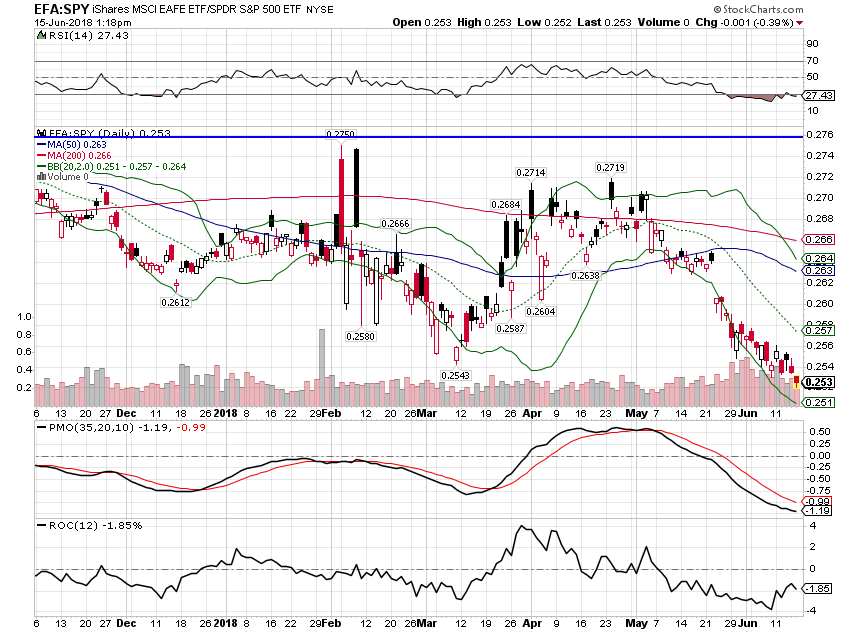
| Currency movements have an impact across markets. The relative performance of foreign stocks versus US stocks has favored US for a long time but the ratio bottomed in late 2016 as the dollar peaked. We are back near those lows now and if the dollar keeps rallying, I’d expect to see continued pressure on non-US shares. It has been a tough few years for value investors and this is just one more example. Any attempt to act rationally based on valuation has been and will be punished by this market. Foreign stocks may be cheaper but the market – at least for now – says there is good reason for that. Maybe, maybe not but history says buying the cheap stuff works over the long term which seems to be defined as just long enough that most people will throw in the towel before it arrives. |
EFA: SPY 2018 |
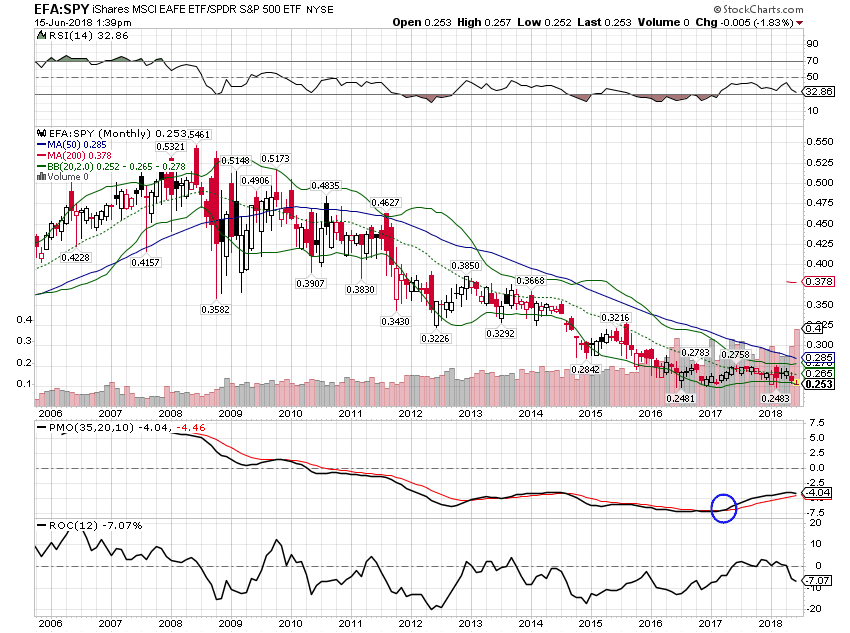
| For what its worth, monthly momentum still favors EFA over SPY. |
EFA: SPY Monthly 2006-2018 |
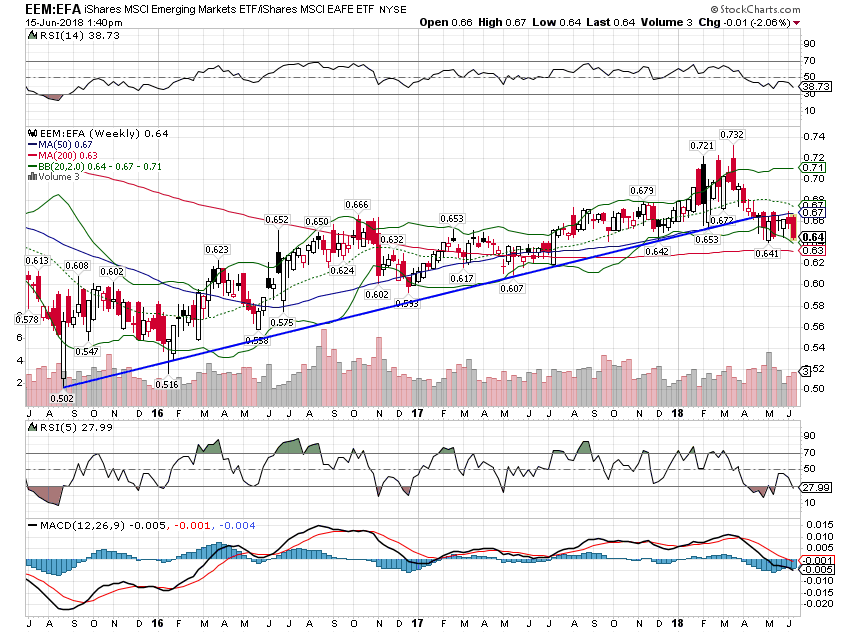
| If anything, EM stocks are even more sensitive to currency movements than their developed counterparts. EM stocks underperformed EFA (and obviously SPY) since the last update. The intermediate uptrend line has been broken although not by much. |
EEM:EFA 2016-2018 |
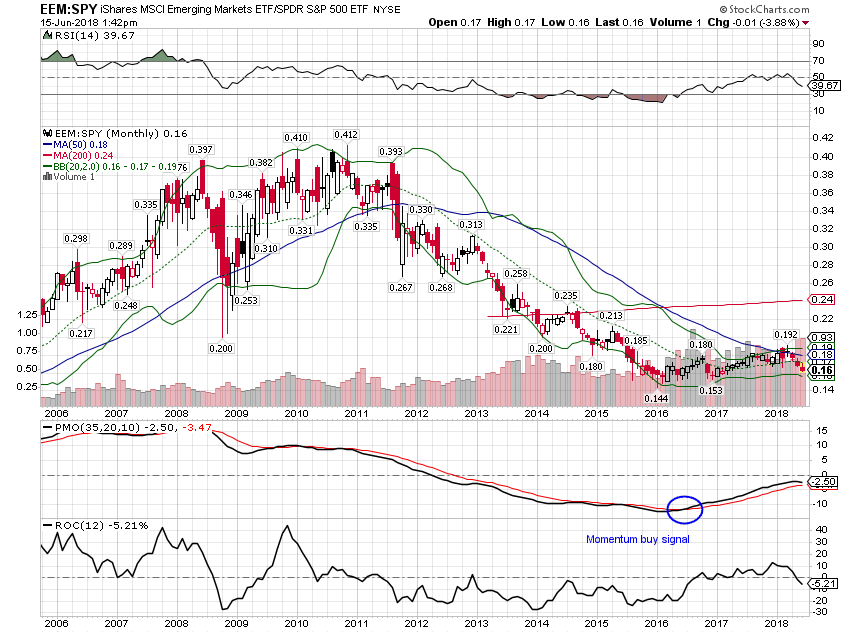
| Long term momentum is still favoring EEM over SPY but that may be challenged in coming days. |
EEM:SPY 2006-2018 |
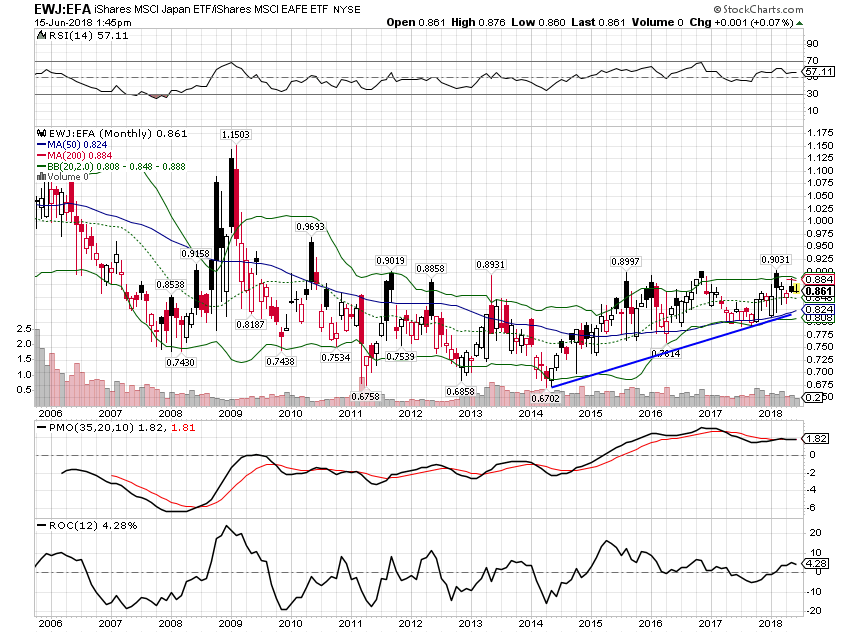
| The uptrend of Japan versus EFA is still intact though. Long term momentum still favors EWJ over SPY but as with EFA and EEM, it is tenuous at best. |
EWJ:EFA 2006-2018 |
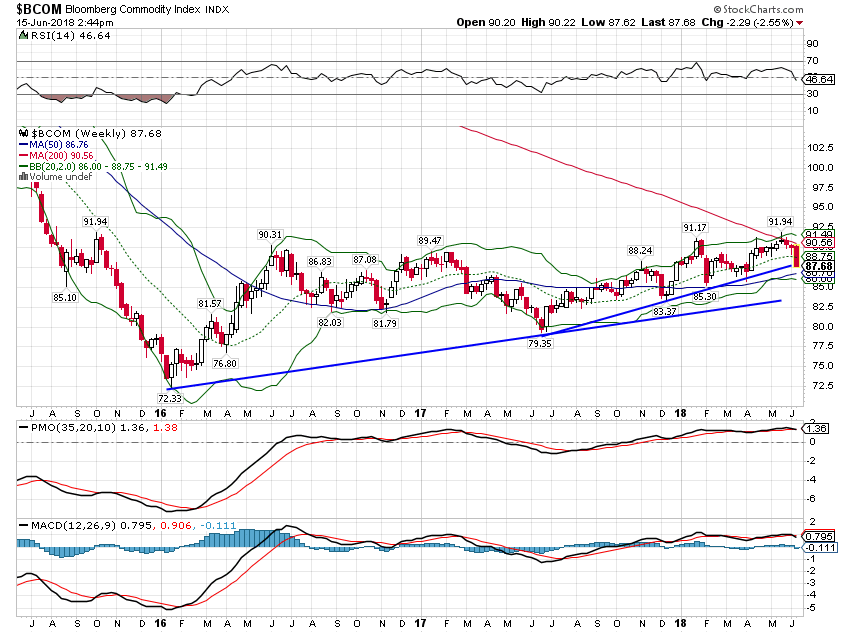
| Commodities had resisted selling off with the rising dollar but that ended last week. It certainly wasn’t surprising to see commodities pull back at such an obvious technical point. The trend is still higher although further correction would just confirm the obvious, that commodities as a class are volatile. That would seem to fail to qualify as news. |
Bloomberg Commodity Index 2016-2018 |
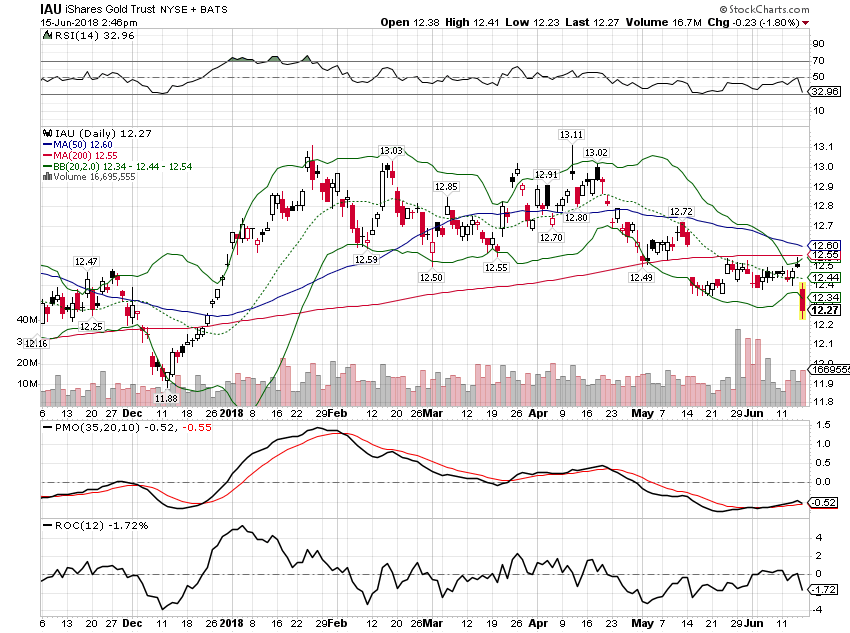
| Gold took its lumps last Friday as well and support is hard to find between here and the late 2017 low. |
iShares Gold Trust 2018 |
| Gold has made a series of higher lows going back to 2016. If this is to be another, it can’t drop much more. |
Gold - Continuous Contract 2016-2018 |
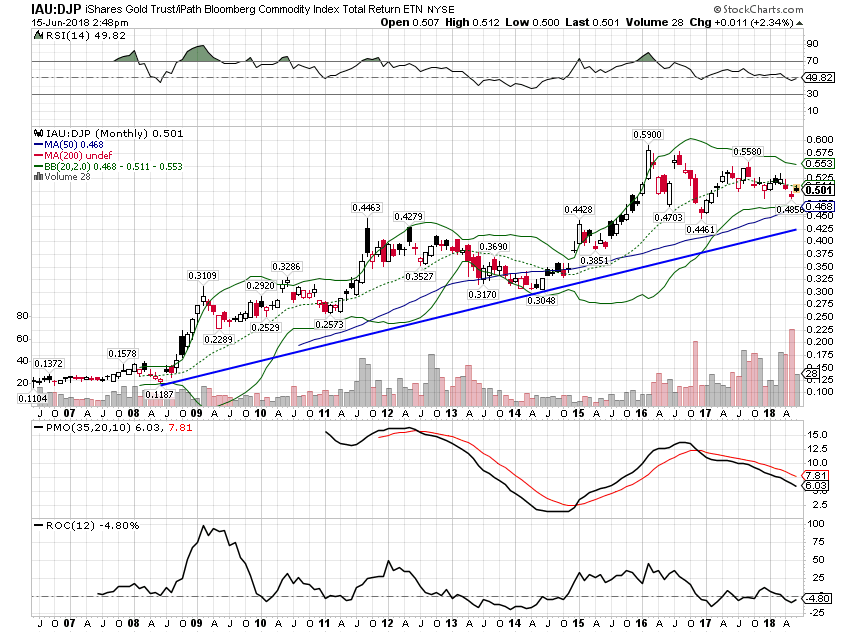
| Long term, gold continues to trend higher versus a more diversified commodity index. |
Bloomberg Commodity Index 2007-2018 |
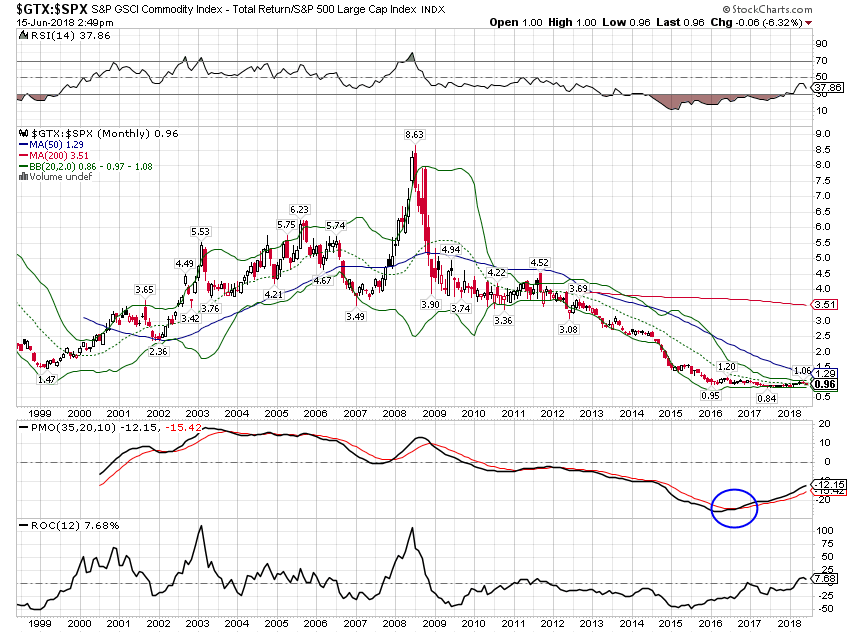
| Despite the setback last week, long term momentum does appear to still be shifting to commodities and away from stocks. Real assets are about as cheap as they have ever been relative to stocks. That won’t last forever; it just feels that way. |
S&P GSCI Commodity Index 1999-2018 |
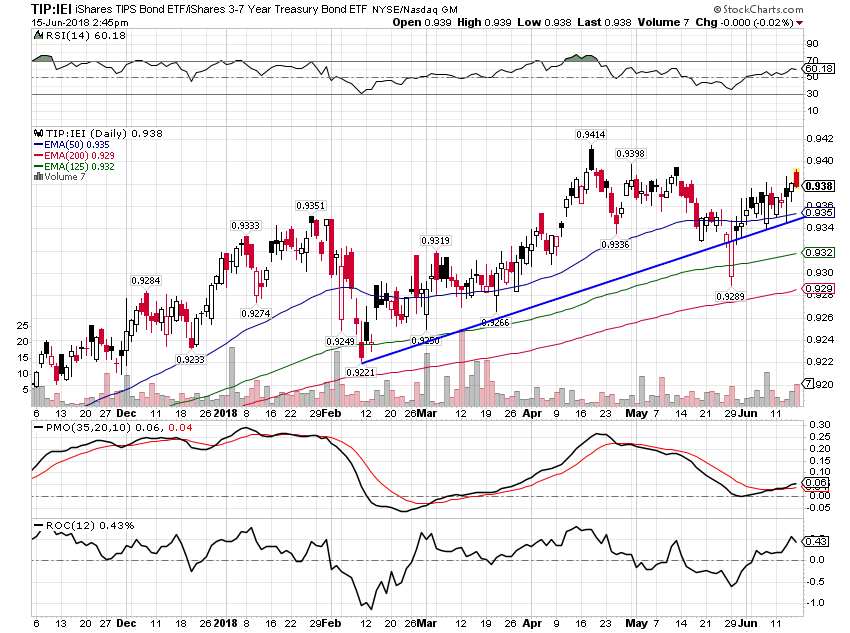
| Inflation protected bonds continue to outperform nominal bonds. That’s mostly a reflection of rising inflation expectations for the short term. As I said above, long term expectations have barely changed. |
TIPS Bond ETF |
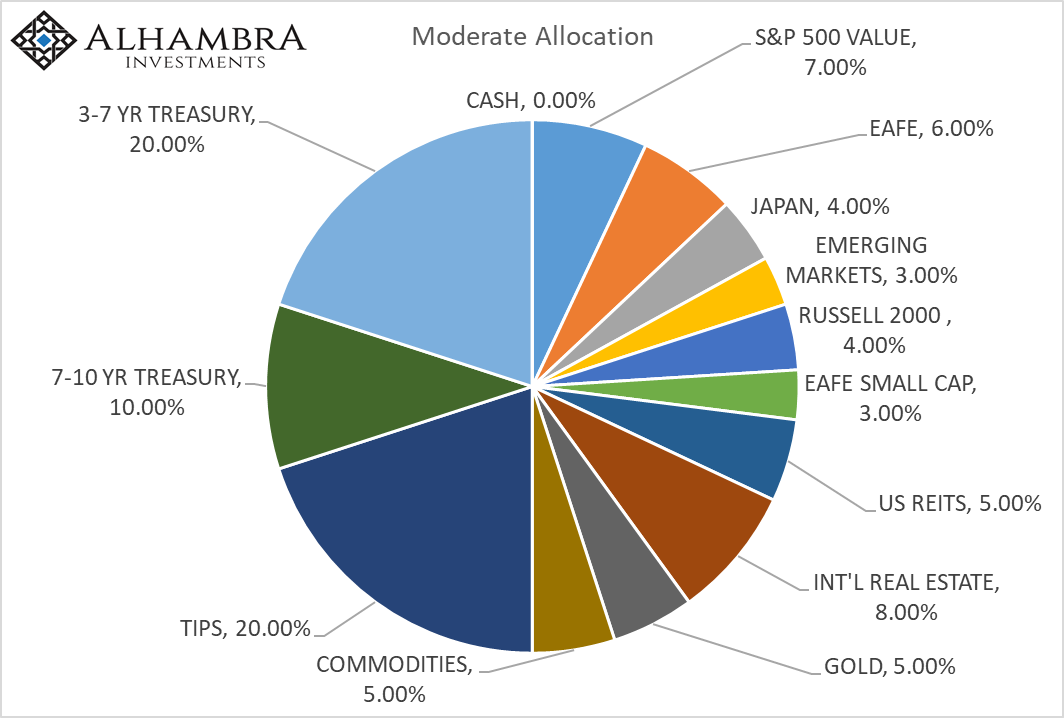
ChangesI am sorely tempted to do nothing this month but the shifts in momentum require a response. I’m certainly not crazy about shifting some of our equity allocation back to the US but with the dollar rising and foreign stocks underperforming it is what our process dictates. Momentum is an important part of what we do and while valuations are high, momentum trumps fundamentals over all but the longest time frames. Reduce EEM by 1%, EFA by 1% and add to IVE. Reduce SCZ by 1% and raise IWN by 1% The weakness in gold also warrants a small change. Growth continues as confirmed by real rates (10 year TIPS) near the highs of the recent range. Gold hasn’t in the past performed well when real rates are rising. Reduce IAU by 2% and add to IYR. |
Moderate allocation, Jun 18 2018 |
Tags: Alhambra Research,Asset allocation,commodities,credit spreads,eafe,Emerging Markets,Global Asset Allocation Update,Gold,inflation expectations,Interest rates,Japan,Markets,momentum,Monetary Policy,newslettersent,recession,Russell 2000,S&P 500,S&P 500 Large Cap Index,small cap stocks,stocks,TIPS,U.S. Treasury,US dollar,US Dollar Index,valuations,Yield Curve


