There are a lot of reasons why interest rates may have risen recently. The federal government is expected to post a larger deficit this year – and in future years – due to the tax cuts. Further exacerbating those concerns is the ongoing shrinkage of the Fed’s balance sheet. Increased supply and potentially decreased demand is not a recipe for higher prices. In addition, there is some fear that the ongoing trade disputes may impact foreign demand for Treasuries. There are also, as our Jeff Snider has reported, some stresses in the Eurodollar market that are impacting Treasuries.
An unappreciated source of volatility is the mortgage market. Holders of mortgage securities, such as mortgage REITs, hedge with Treasuries to maintain their desired duration (or interest rate swaps but the result is the same). As interest rates rise, mortgage securities’ duration lengthens as prepayments slow. To maintain a constant duration, holders of these securities will sell Treasuries. If that weren’t complicated enough, the Fed is a large holder of mortgages and is shrinking its balance sheet. The reduction in mortgage securities so far is minimal but it is expected to accelerate in coming months. But again, we see a situation where a large source of demand in the mortgage market is being removed. If mortgage rates continue to rise, Treasuries will be impacted.
Some of these concerns may be overblown. Tax receipts in April set a record and the surplus for that month was a record too. I think it is way too early to be patting Art Laffer on the back since that is mostly about what happened last year but it is a positive at least for now. As for the trade disputes, I don’t expect the US or the Chinese to do anything really stupid although when talking about politicians in any country one shouldn’t discount that possibility too much. As for the mortgage market, demand may indeed fall but so may supply. Higher interest rates are not going to make houses any more affordable.
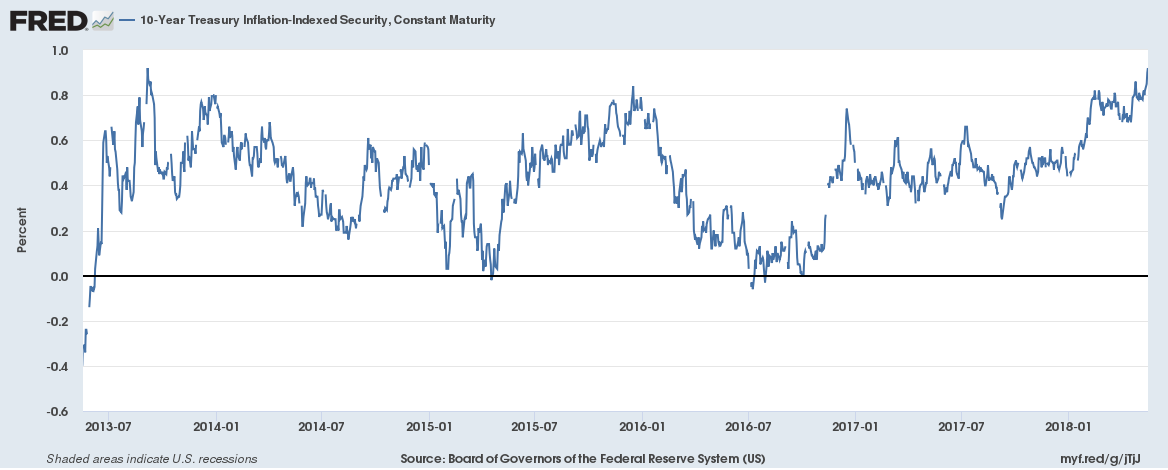
Then there is the Occam’s Razor explanation for rising rates. Rising nominal rates imply rising nominal growth expectations – i.e. inflation + real growth. Treasury yields have been rising all year and have moved to multi-year highs in recent weeks. Part of that is due to rising inflation expectations – which we expect to moderate – but real interest rates are also higher. Indeed, what is significant about the move up in rates since the last update is that real rates have moved above the old range we’ve been in since 2013. It is not by a lot – 3 basis points – but I feel it must be acknowledged. If this continues, it means that we have finally moved on from that stagnant period. I am not convinced that is the case yet but I am open to the possibility.
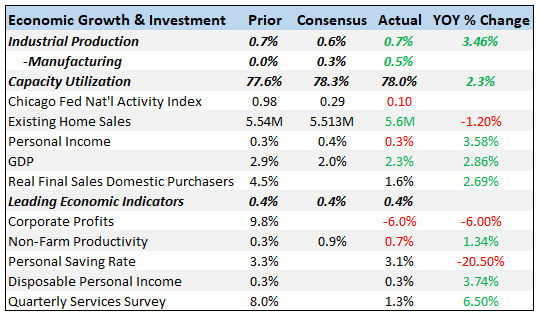
Economic ReportsEconomic Growth & InvestmentIndustrial production was a little better than expected but as has been the case for some time, the composition of that growth worries me. The big gains were – again – for mining and utilities. The rise in utility output could – and I emphasize could – be an indication of broad based growth but a 6% gain year over year seems more likely to point to abnormal weather and higher energy prices being passed through. In any case, I don’t think we can count on that kind of rise in utility output on a regular basis. Shale is also subject to big swings and with the dollar recently gaining some traction that is worrisome. As oil prices rise, shale production can indeed be ramped up quickly but the same works in reverse. If the rising dollar pulls down oil prices, production can be shut in very quickly too. I don’t want to minimize the positives of the shale industry – these are good jobs that pay well and don’t generally require advanced education – but our growing dependence on shale for growth means our economy will be much more volatile. Still, the report was largely positive and in manufacturing the big gainer was business equipment which may bode well for capital investment. |
Economic Growth & Investment |
ProductionBoth the Empire State and Philly Fed reports were better than expected with the Philly Fed showing new orders at a 45 year high. Sentiment in the manufacturing economy remains very strong. |
Production |
Consumption & DistributionConsumption in Q1 wasn’t very good and Q2 doesn’t look much better so far. Year over year sales growth of less than 5% is not all that good compared to previous expansions. The details of the report were very mixed; furniture up and restaurants down, apparel up and department stores up but only 0.2% after big declines in recent months. |
Consumption and Distribution |
InventoriesInventories were flat in March which will probably pull down the Q1 GDP number a little. Total business sales were up 0.5% as the inventory/sales ratio dropped one tenth. I’d still like to see inventories a little leaner relative to sales but overall inventories seem okay. |
Inventories |
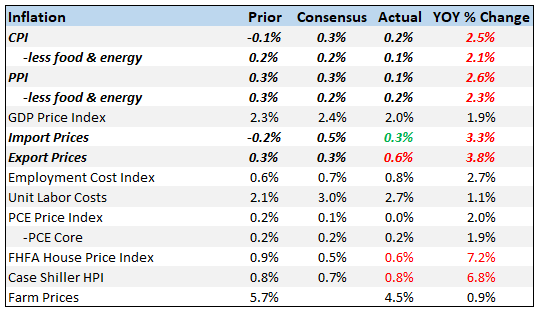
InflationThe inflation reports both showed a moderation since the last report. Producer prices were up just 0.1% and that included a surge in steel prices due to tariffs. On the consumer side, prices also rose less than expected. Medical costs were up just 0.1% while prices for communications, recreation and new and used cars were all lower. On the plus side gasoline was up big and rents rose too. Overall, though these reports should ease inflation concerns. |
Inflation |
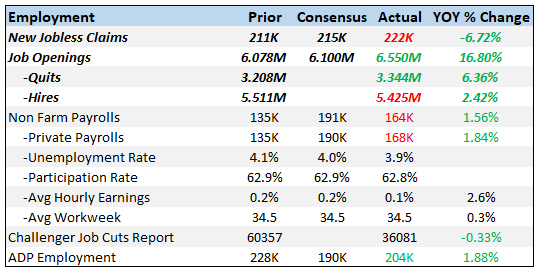
EmploymentThere are now more job openings than people looking for jobs, an extraordinary situation that has never happened before. Quits were also up in a sign that workers are pretty confident. The only metric still lagging here is the one that really matters – hires. Is that the skills mismatch we hear so much about? Plenty of people but not enough of the ones with the right skills? Or is it the opioid epidemic where there are plenty of people but not enough who can pass a drug test? Or something else? I honestly don’t know the answer but it is probably a combination of those and also a measurement problem. On-line recruiting has skewed this report but I don’t know the degree. I still say that if there was a shortage of workers we’d be seeing much faster wage growth. But, taken at face value, this is a pretty good report. |
Employment |
ConstructionBoth housing starts and permits were lower in April but the decline was led by multi-family which surged higher in March. Single family starts were basically flat while permits were up 0.9%. Housing added nothing to Q1 GDP and this report means that so far, Q2 doesn’t look much better. |
Construction |
SentimentBoth the consumer sentiment reports were a little less than expected but still at high levels. |
|
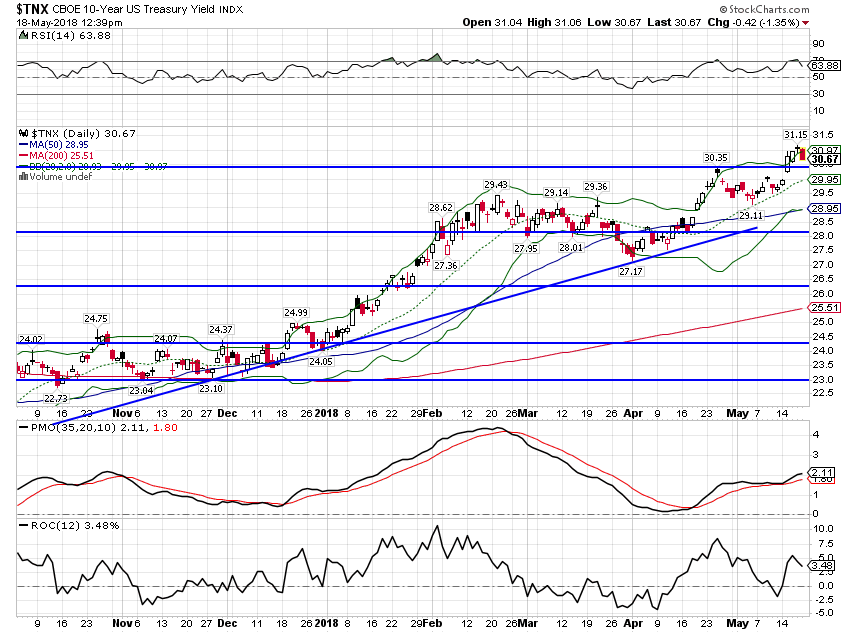
Market Indicators10-Year Treasury Note YieldThe 10-year yield hit 3.12% and then pulled back. Momentum still seems to be pointing to further upside in yields but market positioning reveals a plethora of shorts in the market. Spec shorts are hitting records all across the spectrum of bonds. From a contrarian standpoint, imbalances like that generally get corrected although this one has lasted for longer than many previous, similar episodes. But those shorts will be covered at some point and we’ll get a big rally that no one expects. Will it be soon? Risk still appears to be up to about 3.25% but I’d be looking for some kind of rally before we test that level. As I said above, the Occam’s Razor explanation for these rising rates is a rise in nominal growth expectations and I generally take it that way. I do think there are some technical factors at work here too as well as some fear over the supply/demand situation. But I am also cognizant of reflexivity; it may well be that higher rates will induce higher growth. Rising interest rates may be bad for borrowers but not for savers and those people are starting – finally! – to see some relief in the form of higher income. |
US Treasury Yield Index, Nov 2017 - May 2018 |
10-Year TIPS YieldTIPS yields have broken above the September 2013 high of 0.92%, with the 10 year TIPS hitting 0.95%. I’d say that is a tentative breakout but one that could easily be reversed with some weak economic data. As I said above though, if it continues it heralds improved investment spending and real growth. |
10-Year Treasury Inflation - Indexed Security, Jul 2013 - May 2018 |
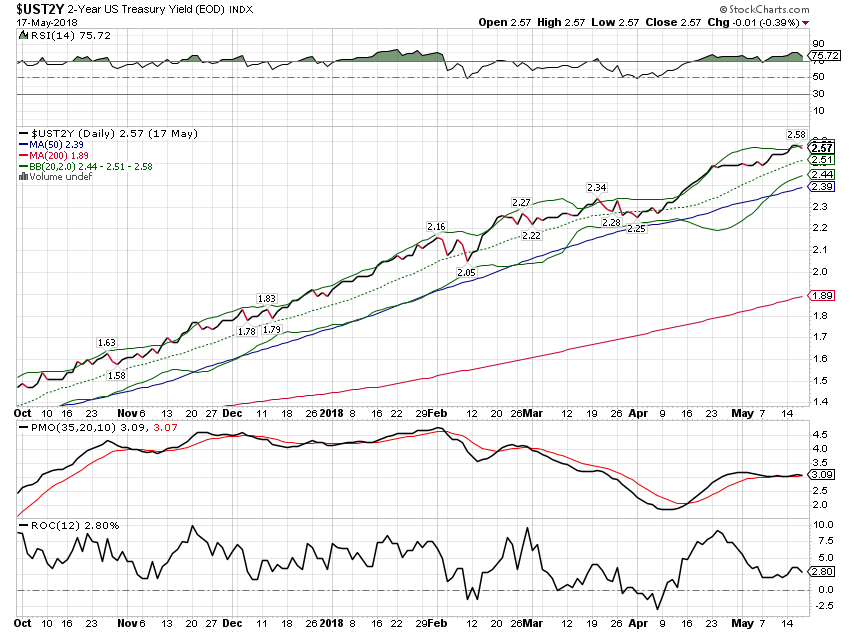
2-Year Treasury YieldThe two year continues its seemingly relentless march higher. This rate largely represents expectations of Fed policy so this isn’t surprising. |
2-Year US Treasury Yield Index, Oct 2017 - May 2018 |
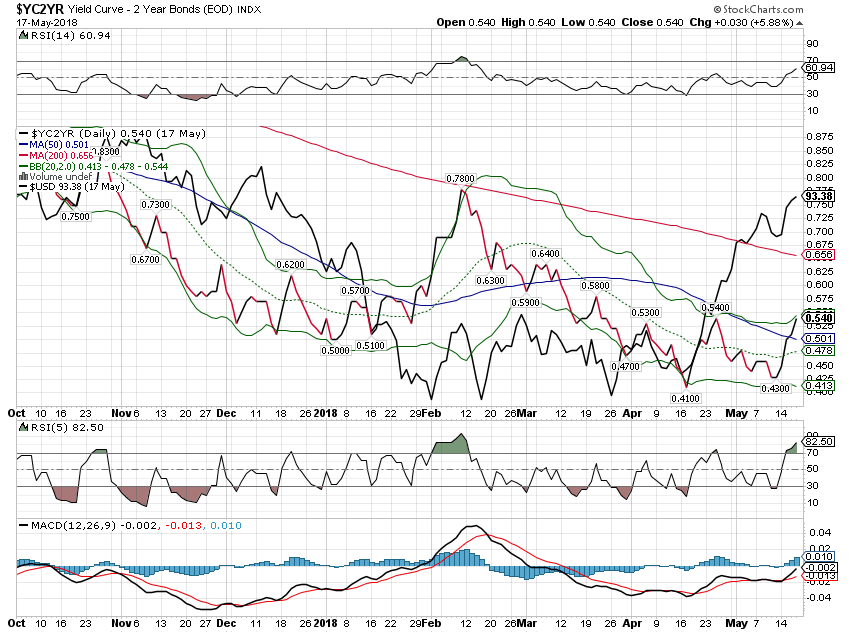
10/2 Yield CurveWith the 10 year playing a little catch up to the 2 year, the yield curve steepened slightly since the last update. Small moves like this don’t mean much. |
Yield Curve - 2 Year Bonds Index, Oct 2017 - May 2018 |
| The steepening curve also pulled the dollar a little higher. I don’t expect the steepening or the dollar rally to last. |
Yield Curve - 2 Year Bonds Index, Oct 2017 - May 2018 |
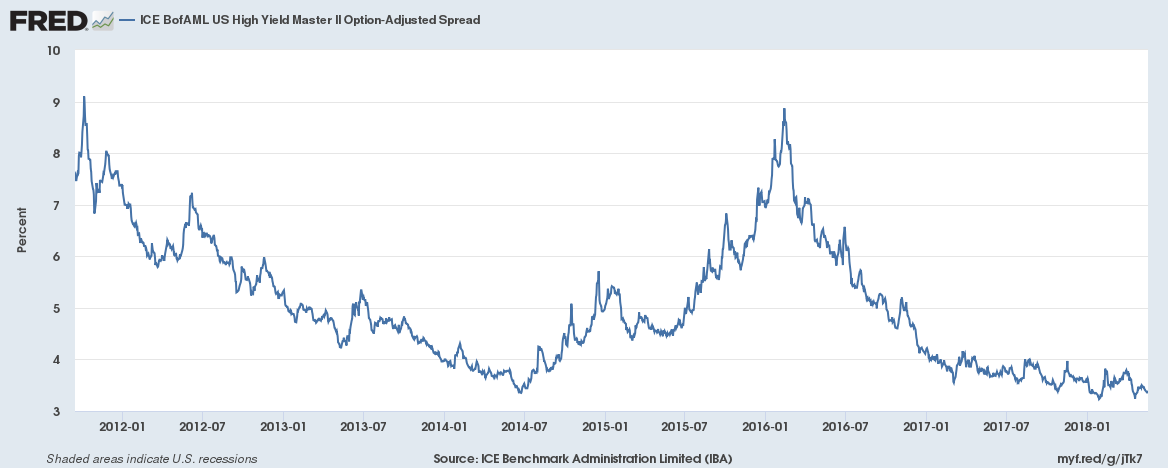
Credit SpreadsThere is just no indication of stress in the junk bond market. They’ve basically sold off in line with Treasuries and the spread hasn’t moved. This could go on for a while with spreads just staying low. That happened in the last cycle when spreads basically traded sideways from May 2005 to May 2007. I’m not saying that will happen this time but we should keep in mind that benign conditions can last for some time. |
ICE BofAML US High Yield Master II Option-Adjusted Spread, Jan 2012 - May 2018 |
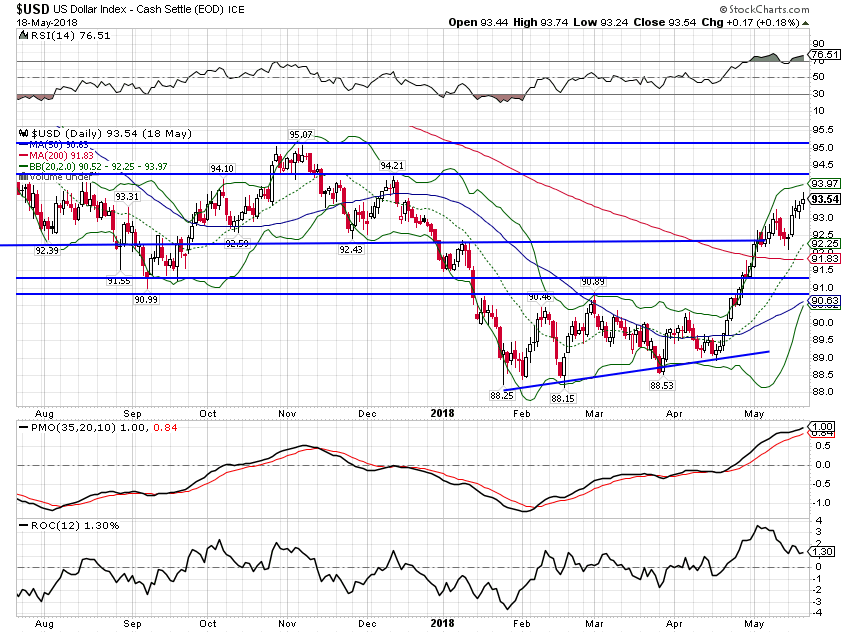
US DollarThe dollar continued its recent rally but is now quite overbought with the rate of change slowing. Longer term measures of momentum continue to point to lower. |
US Dollar Index, Aug 2017 - May 2018(see more posts on U.S. Dollar Index, ) |
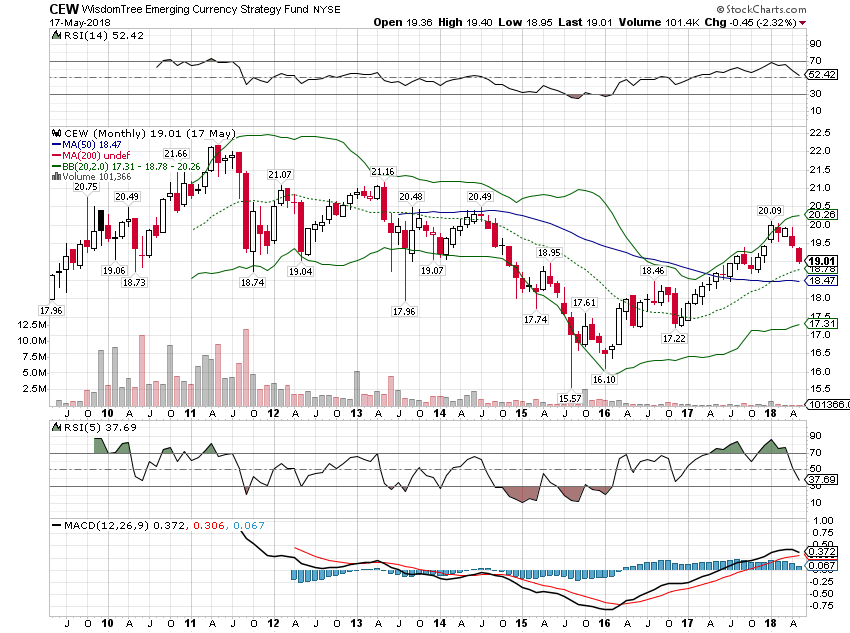
| Emerging market currencies are down and the press coverage makes it sound like armageddon. In the 2015/16 crash this broad based ETF of emerging currencies fell by over 20%. This latest pullback amounts to a little over 5% or about the same as the Euro drop. Such negative sentiment on such a small move might be a good opportunity for a contrarian. |
WisdomTree Emerging Currency Strategy, Jul 2009 - May 2018 |
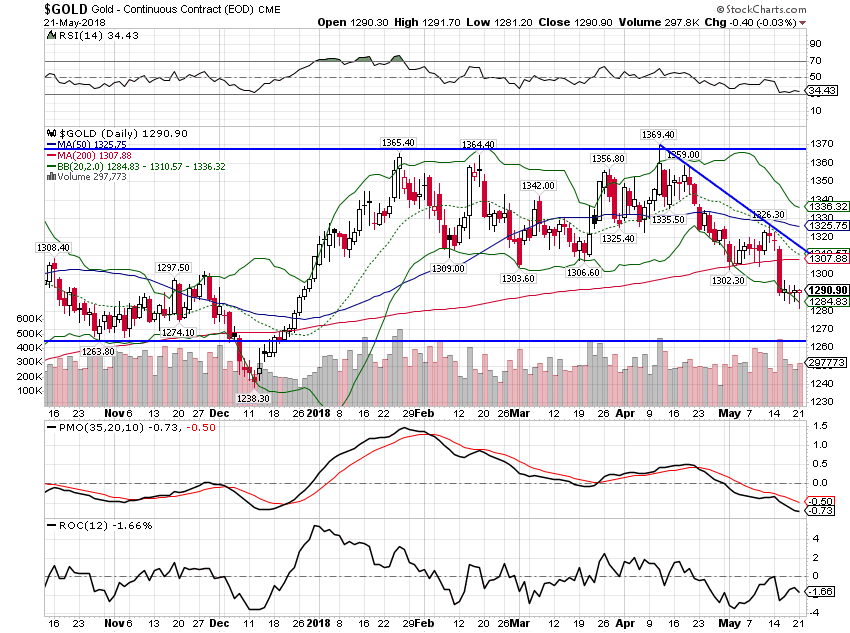
CommoditiesFurther supporting the rising growth expectations theme is the continued weakness in gold. Given the dollar strength it really hasn’t performed that badly though. Since moving sharply off the lows back at the beginning of 2016, gold has been in a consolidation (sideways) pattern. Ultimately, its direction will be determined by the dollar. If the dollar resumes its downtrend – and if those budget deficits do emerge it probably will – then gold will break out of this pattern to the upside. If growth takes off and the dollar with it – which is hard to picture given our dependence on high oil prices for growth – then gold will resume the downtrend it started in late 2011. |
Gold Daily, Nov 2017 - May 2018 |
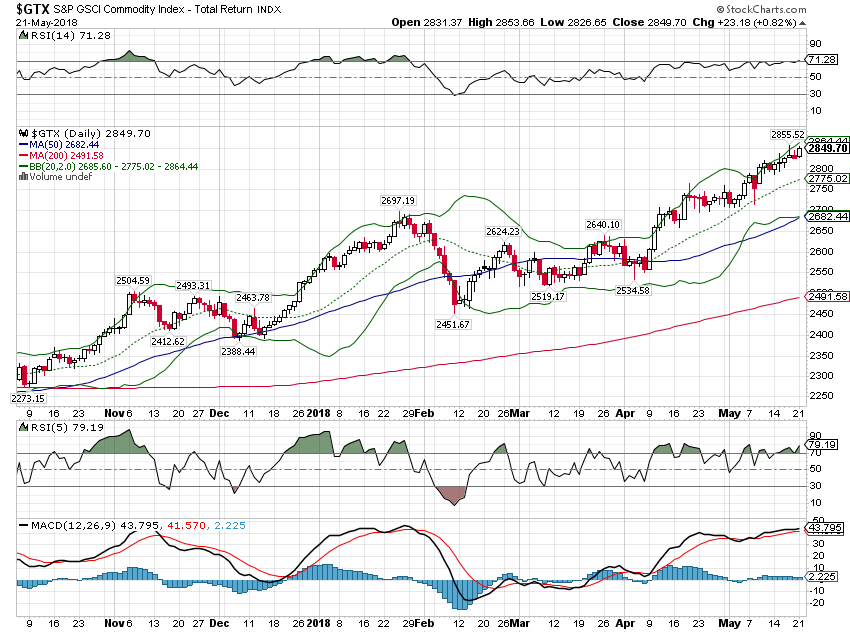
| The GSCI, in contrast to gold, continues its uptrend. The resilience in gold and the continued uptrend of commodities in general makes me think the dollar will resume its decline. |
S&P GSCI Commodity Index, Nov 2017 - May 2018 |
| Commodities can climb with the dollar but will generally be outperformed by stocks when that happens. This year commodities are outperforming stocks. |
S&P GSCI Commodity Index - Total Return/S&P 500 Large Cap Index, Nov 2017 - May 2018 |
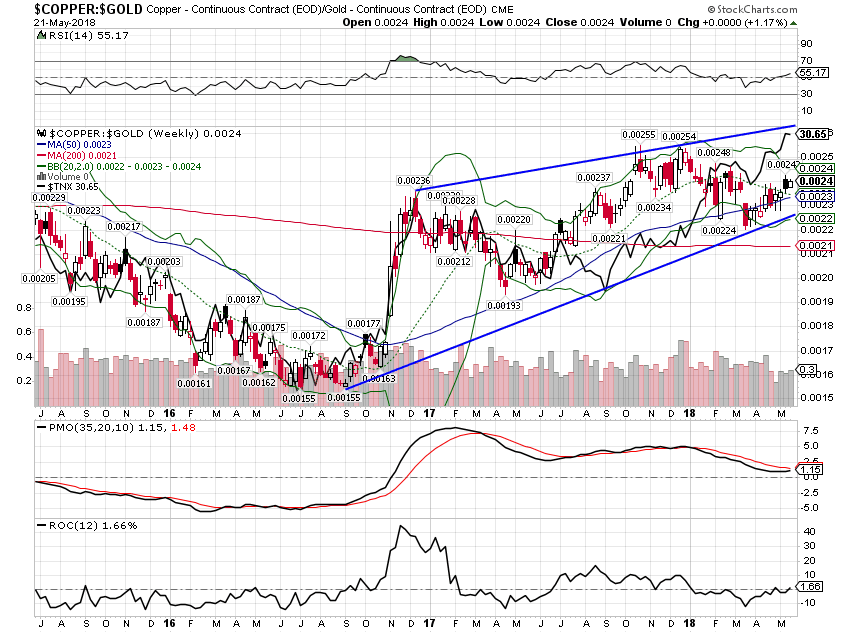
| I said in the last update that I thought the gap between the copper/gold ratio and the 10 year yield would be resolved by lower yields. A classic case of confirmation bias I suppose. The copper/gold ratio moved higher since the last update and so did yields. Weekly momentum is on the verge of confirming the strength. I’ll try to keep my cognitive biases to myself from now on. |
Copper:Gold Weekly, Jun 2015 - May 2018 |
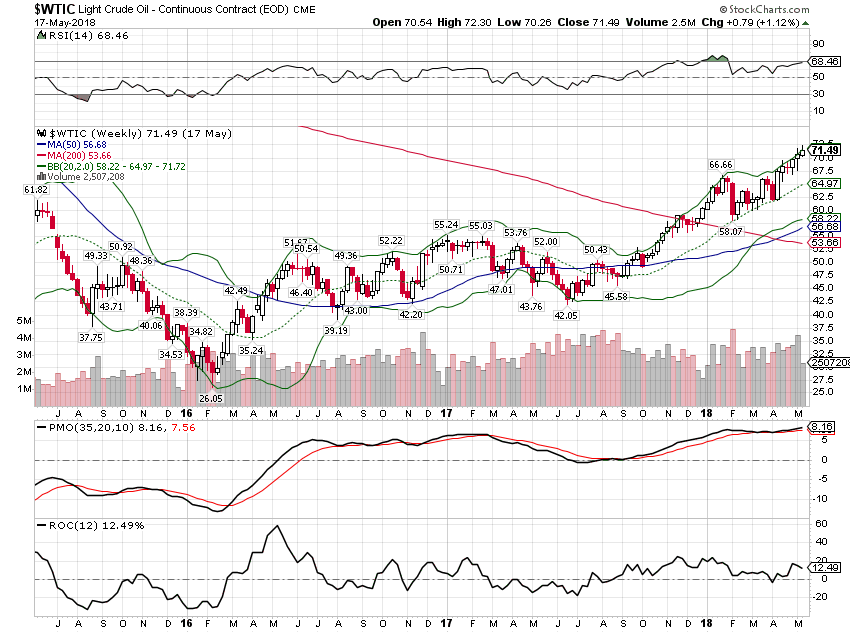
| Oil prices continue higher too, leading the GSCI. The Bloomberg commodity index is trending up too but that index is more evenly allocated while the GSCI is heavily weighted to energy. Where is the point where higher energy prices become a negative for the US economy? I don’t have an answer for that one but we were doing okay with prices over $100 from 2012 to 2014. |
Light Crude Oil - Continuous Contract, Jun 2015 - May 2018 |
Our economic growth has become overly dependent on high oil prices in recent years. A few years ago we almost fell into recession when oil prices fell to $30. Now, with prices over $70, growth is trending a bit higher. Bond markets reflect this swing higher in growth but right now it isn’t a big swing up. Where growth from 2013 to 2017 was in a range of 1.5% to 2.5%, we may be seeing the range shift a bit higher, maybe more like 2.75% on the upper end.
I would like to see more growth and investment in other areas of the economy. Companies have talked a good game of capital investment on the conference calls but we have yet to see any significant gain in the aggregate numbers of the economy. Higher real interest rates may well be a harbinger of more investment to come but I would wait to see the whites of its eyes. We’ve had a lot of false starts over the last decade and this may well be just another one.
One thing our market indicators say with confidence – recession is not on the horizon right now. The yield curve is flattening but not flat and short term rates are still rising. Credit spreads are just off the lows of this cycle and there is still room for them to narrow more if past cycles are any guide. This expansion cycle has not been a robust one and our economy is a long way from operating at peak performance. But this expansion has been persistent if nothing else and it looks likely to continue.
Tags: Bi-Weekly Economic Review,Bonds,commodities,Construction,Consumer Sentiment,copper/gold ratio,credit spreads,currencies,economy,Emerging Markets,employment,Gold,inflation,Interest rates,Inventories,Markets,newslettersent,oil prices,real interest rates,Retail sales,Taxes/Fiscal Policy,TIPS,U.S. Dollar Index,US dollar,Yield Curve


