George Dorgan
My articles My siteAbout meMy videosMy books
Follow on:LinkedINTwitterSeeking Alpha
CFA SocietyEconomicBlogs
We do not like Purchasing Power or Real Effective Exchange Rate (REER) as measurement for currencies. For us, the trade balance decides if a currency is overvalued. Only the trade balance can express productivity gains, while the REER assumes constant productivity in comparison to trade partners.
Who has read Michael Pettis, knows that a rising trade surplus may also be caused by a higher savings rate while the trade partners decided to spend more. This is partially true.
Recently Europeans started to increase their savings rate, while Americans reduced it. This has led to a rising trade and current surplus for the Europeans.
But also to a massive Swiss trade surplus with the United States, that lifted Switzerland on the U.S. currency manipulation watch list.
To control the trade balance against this “savings effect”, economists may look at imports. When imports are rising at the same pace as GDP or consumption, then there is no such “savings effect”.
After the record trade surpluses, the Swiss economy may have turned around: consumption and imports are finally rising more.
Swiss National Bank wants to keep non-profitable sectors alive
Swiss exports are moving more and more toward higher value sectors: away from watches, jewelry and manufacturing towards chemicals and pharmaceuticals. With currency interventions, the SNB is trying to keep sectors alive, that would not survive without interventions.
At the same time, importers keep the currency gains of imported goods and return little to the consumer. This tendency is accentuated by the SNB, that makes the franc weaker.
Texts and Charts from the Swiss customs data release (translated from French).
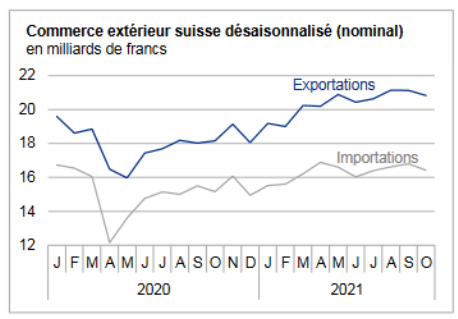
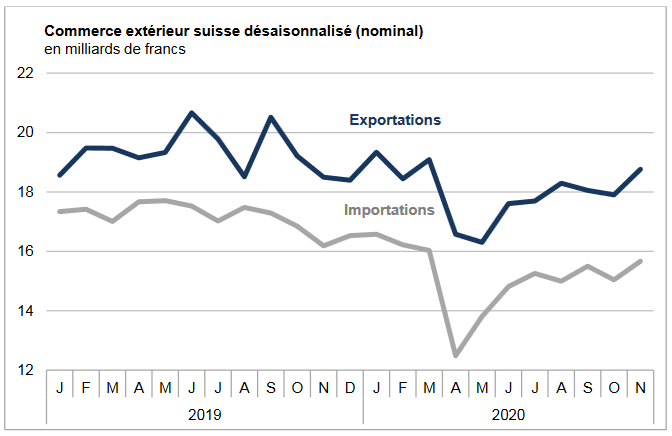
Exports and Imports YoY DevelopmentIn the first quarter of 2018 and on a seasonally adjusted basis, foreign trade confirmed the positive trend of previous quarters. Both traffic directions have also reached record levels. Exports increased by 0.2% and imports by 4.1%. The divergent evolution of inflows and outflows has led to the smallest trade surplus in four and a half years. ▲ Exports: all key sectors in good shape |
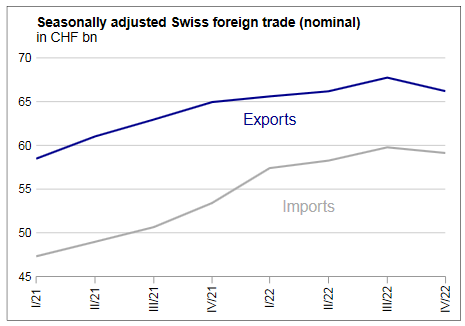
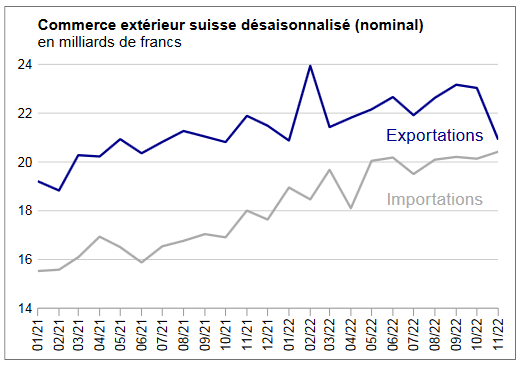
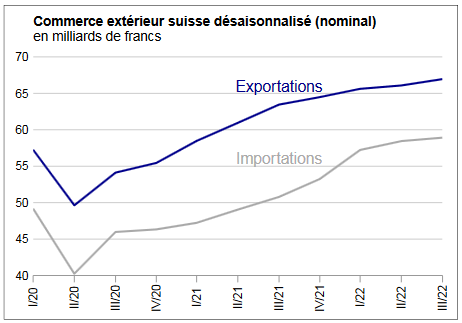
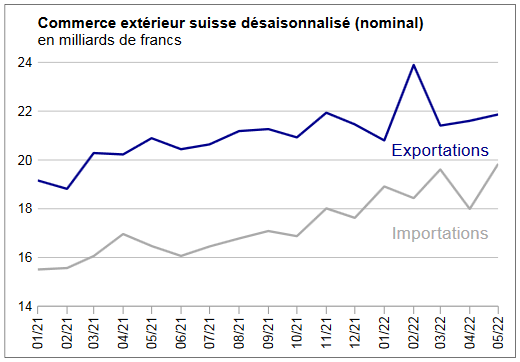
Swiss exports and imports, seasonally adjusted (in bn CHF), Q1 2018(see more posts on Switzerland Exports, Switzerland Imports, )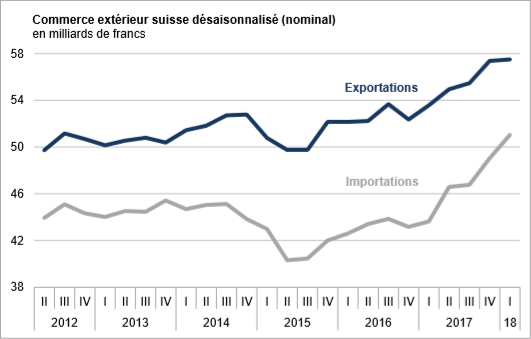 Source: Swiss Customs - Click to enlarge |
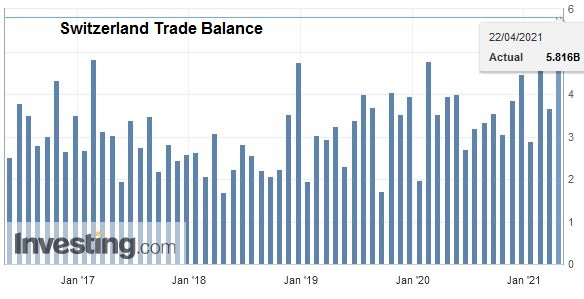
Overall evolutionAfter rising in the last quarter of 2017, seasonally adjusted exports rose by 0.2% in the first quarter of 2018 (actual: -1.8%) to a record level of 57.5 billion francs. The positive trend of previous periods has thus continued. After an impressive first quarter, imports jumped again (+ 4.1%, real: + 2.0%), crossing for the first time the quarterly bar of 50 billion francs. They saw their dynamism gain even more intensity for a year to strengthen by 17% over the period. The trade balance closed with a surplus of 6460 million francs, the lowest since the third quarter of 2013. |
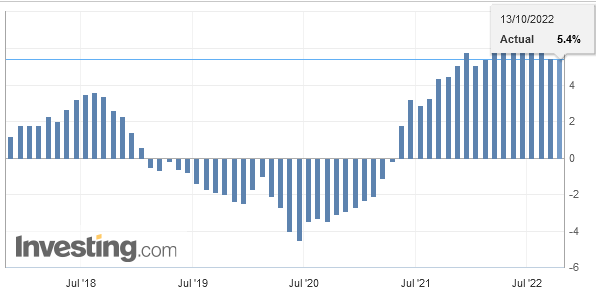
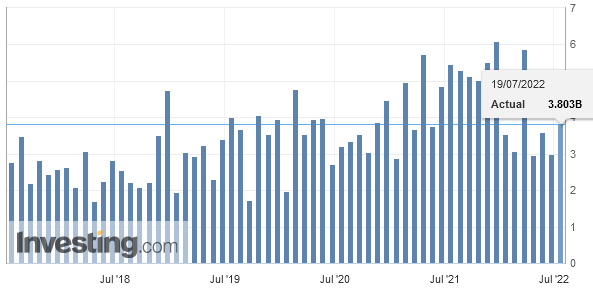
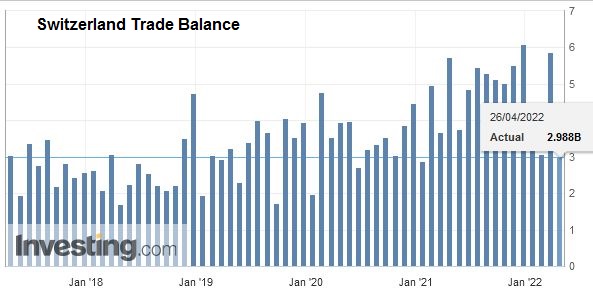
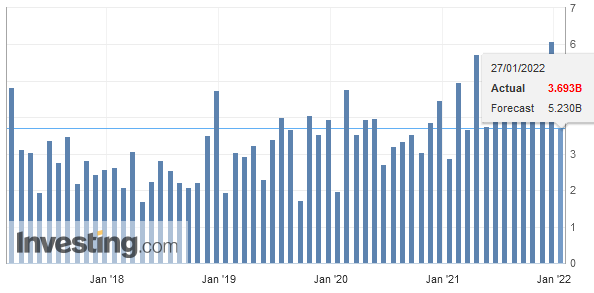
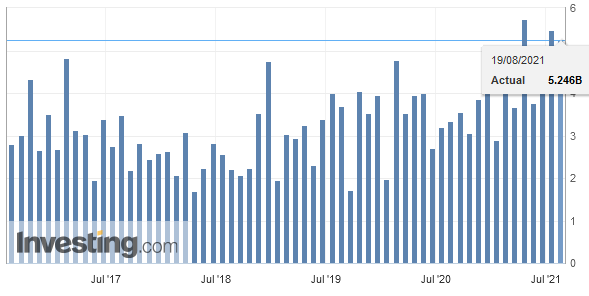
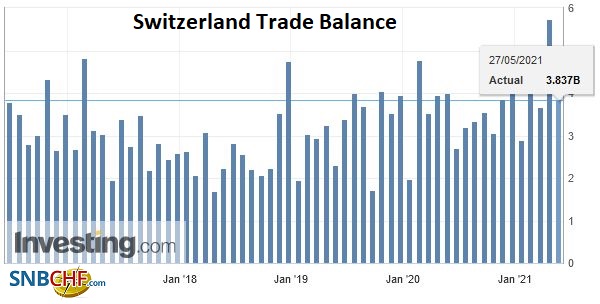
Switzerland Trade Balance, Q1 2018(see more posts on Switzerland Trade Balance, )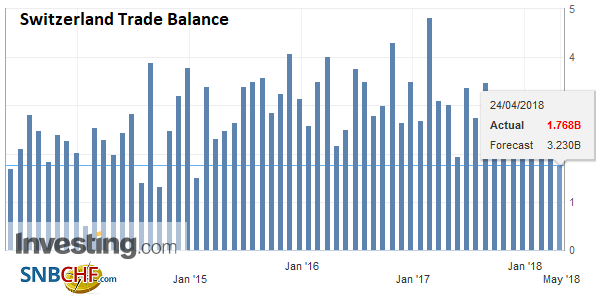 Source: Investing.com - Click to enlarge |
ExportsWatchmaking regains color with a 5th consecutive increaseThe four main merchandise groups have been showing a positive trend since the end of 2016. In the first quarter of 2018, two of them continued to grow: watch exports jumped 4.9% to lower than past peaks and chemicals and pharmaceuticals, the flagship sector, increased by 0.7%. Sales of active ingredients increased by 449 million francs. Conversely, the machinery and electronics sector and the precision instruments sector stagnated. Among other commodities, the plunge in the vehicle sector (aircraft: -345 million francs) weighed on the result. From a geographical point of view, Swiss exports have progressed towards the three main markets. Up 3.9%, North America played the spearhead (Canada: +112 million, USA: +109 million francs) and at the same time confirmed its dynamism of the previous periods. Exports increased by 1.0% to Europe against 0.9% to Asia. In the Eurozone, Spain, in better shape, as well as the Netherlands and Germany have pulled out of the game. With this trio, turnover increased by around 500 million francs during the first quarter of 2018. It fell by 410 and 222 million francs respectively with the United Kingdom and France. Since mid-2016, these two partners have recorded a disparate but globally negative evolution. On the Asian side, while shipments to China and Hong Kong have consolidated, those to the United Arab Emirates have plunged 164 million francs. |
Swiss Exports per Sector Q1 2018 vs. 2017(see more posts on Switzerland Export, Switzerland Exports by Sector, )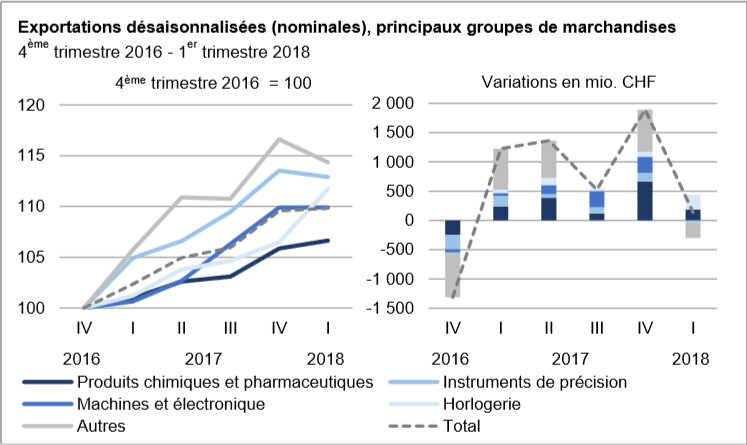 Source: Swiss Customs - Click to enlarge |
ImportsAsian imports: 30% growth over a year and a halfIn the first quarter of 2018, seasonally adjusted imports accelerated for three of the four major commodity groups. 85% (CHF 1.7 billion) of the increase was based on chemicals and pharmaceuticals (+ 14.7%), which at the same time posted a record high. Although this sector has shown a positive trend since the end of 2016, it has nevertheless evolved in a heterogeneous way. At the level of the sub-groups, raw materials and basic materials (+495 million francs) and active ingredients (+740 million) shone. Aeronautics made rain and shine in vehicles (+211 million francs). On the other hand, metal imports have been showing continued dynamism since the end of 2016. In the first quarter of 2018, they have risen to a level that has been higher for the last ten years. Although the machinery and electronics sector stagnated, the positive trend of the previous quarters was nevertheless confirmed. On the continents, the rise in imports took hold in Europe and Asia, the two main Swiss suppliers. These regions have drawn a clearly bullish trend over the last quarters. Of the last six, Asian shipments jumped 30%. In the first quarter of 2018, however, Singapore’s growth contrasted with the decline in the United Arab Emirates (-604 million francs, jewelery) and Japan (-101 million). In Europe, Ireland, the United Kingdom and Austria have carded; Imports (mainly pharma products) from this trio swelled by 1.5 billion francs. Over the last three semesters, the evolution of entries from North America has been volatile; the decline in the first quarter of 2018 can be explained by the contraction of Canada (-132 million francs). |
Swiss Imports per Sector Q1 2018 vs. 2017(see more posts on Switzerland Imports, Switzerland Imports by Sector, )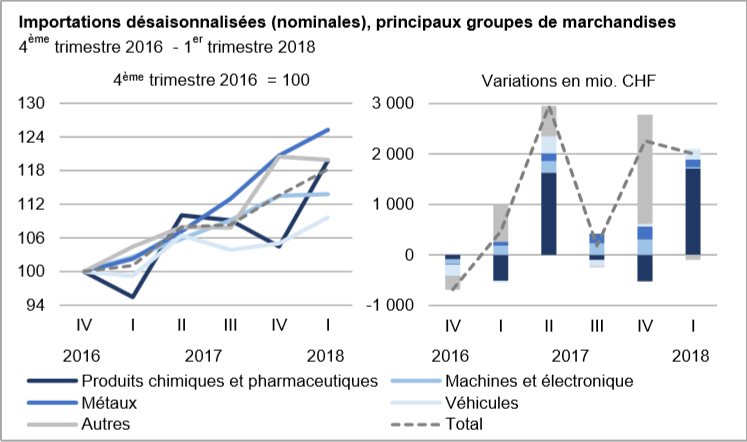 Source: Swiss Customs - Click to enlarge |
Tags: newslettersent,Switzerland Export,Switzerland Exports,Switzerland Exports by Sector,Switzerland Imports,Switzerland Imports by Sector,Switzerland Trade Balance