Marc Chandler
My articles My offerMy siteAbout meMy videosMy books
Follow on:LinkedINTwitterSeeking AlphaAmazon
The US jobs growth slowed in March more than expected, but the details of the report suggest investors and policymakers will look through it. The poor weather seemed to have played a role. Construction jobs fell (15k) for the first time since last July, and the hours worked by production employees and non-supervisory worker slipped.
United StatesThe 103k net new jobs were the least since last September when storms also distorted the report. Job growth in February was revised higher to 326k. Taken together, the February and March job creation average a little more than 210k, and even with the downward revision in January, the average monthly job growth in Q1 18 was a still impressive 202k. |
U.S. Nonfarm Payrolls, May 2013 - Apr 2018(see more posts on U.S. Nonfarm Payrolls, ) Source: Investing.com - Click to enlarge |
| Average hourly earnings rose as expected by 0.3% and this lifted the year-over-year rate to 2.7%, which is the upper end of the range for the last several quarters. |
U.S. Average Weekly Hours, May 2013 - Apr 2018(see more posts on U.S. Average Weekly Hours, )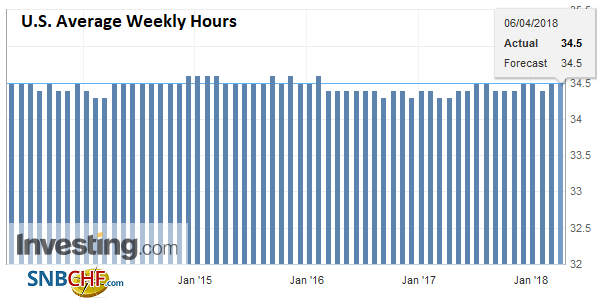 Source: Investing.com - Click to enlarge |
| The unemployment rate was unchanged at 4.1% for the sixth month. One bright spot was the under-employment rate fell to 8.0% from 8.2%, which is a new cyclical low and speaks to slack still being absorbed.
The other theme that has been evident is the improvement in manufacturing employment. It rose by 22k and brought the first quarter total to 74k. This lagged behind the 89k increase in Q4 but is still among the best quarterly performances since the Great Financial Crisis. |
U.S. Unemployment Rate, May 2013 - Apr 2018(see more posts on U.S. Unemployment Rate, ) Source: Investing.com - Click to enlarge |
| The participation rate ticked down to 62.9% from 63.0%. A year ago it was at 63.0% too. Note that over the past 12 and 24 months, the participation rate has averaged 62.8%. |
U.S. Participation Rate, Sep 2014 - Apr 2018(see more posts on U.S. Participation Rate, )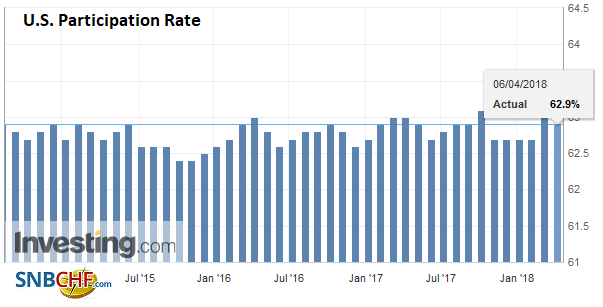 Source: Investing.com - Click to enlarge |
CanadaCanada also reported its March employment data. The optics were better. Canada created 32.3k new jobs, which was almost half again as much as economists expected. These were all full-time positions (+68.3k while almost 36k part-time positions were lost). |
Canada Employment Change, May 2013 - Apr 2018(see more posts on Canada Employment Change, )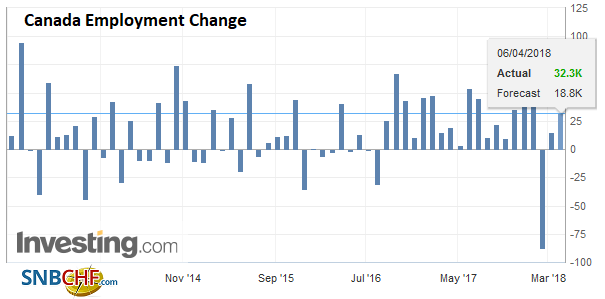 Source: Investing.com - Click to enlarge |
|
The participation rate was unchanged at 65.5% |
Canada Participation Rate, May 2013 - Apr 2018(see more posts on Canada Participation Rate, )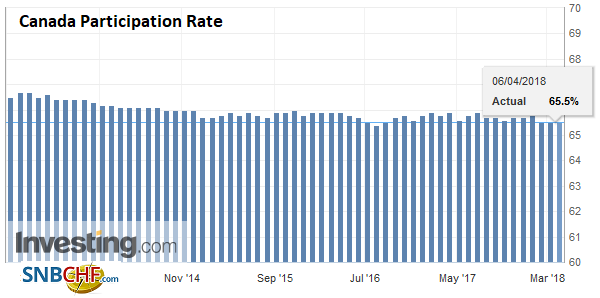 Source: Investing.com - Click to enlarge |
| The unemployment rate was also unchanged at 5.8%. The one notable disappointment was the unchanged hourly earnings of permanent workers at 3.1%. Economists had expected an increase. |
Canada Unemployment Rate, May 2013 - Apr 2018(see more posts on Canada Unemployment Rate, ) Source: Investing.com - Click to enlarge |
The Canadian dollar strengthened. Recall the US dollar fell through the neckline of a potential topping pattern near CAD1.2800 earlier in the week. It is not uncommon to retest the neckline of this pattern, which is what the greenback did yesterday and earlier today.
More broadly the US dollar softened in response to the headline disappointment, but given the trade backdrop, many participants lack conviction. The euro is holding a key trendline near $1.2220. Initial resistance is seen near $1.2260 and then $1.23. The dollar is holding above JPY107, as it continues to flirt with a breakout of a potential bottoming pattern. Sterling is trying to re-establish its foothold above $1.40.
US rates are a bit lower, with the 10-year testing 2.80% and the 2-year pushing back below 2.30%. Stocks are still called broadly lower after yesterday’s rally and the threat of escalating trade tensions.
Full story here Are you the author?Tags: #GBP,#USD,$CAD,$EUR,$JPY,$TLT,Canada Employment Change,Canada Participation Rate,Canada Unemployment Rate,jobs,newslettersent,SPY,U.S. Average Hourly Earnings,U.S. Average Weekly Hours,U.S. Nonfarm Payrolls,U.S. Participation Rate,U.S. Unemployment Rate