Summary:
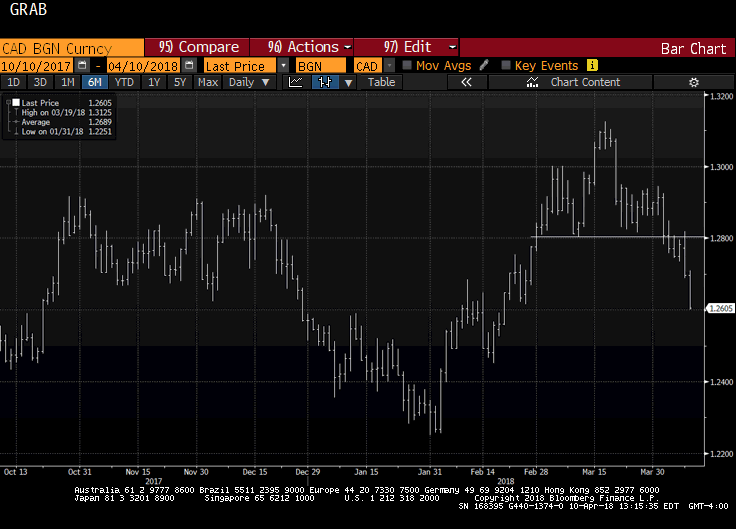
USD has been carving out a head and shoulders pattern against the Canadian dollar.
The neckline was retested yesterday and the follow-through selling materialized today after an outside down day yesterday.
The measuring objective is near CAD1.2475.
| For a little more than two weeks, we have been monitoring the formation of a possible head and shoulders top in the US dollar against the Canadian dollar. The neckline broke a week ago. It is not uncommon for the neckline to be retested after the break. That was what happened yesterday.
The US dollar recorded an outside down day yesterday. It traded on both sides of Friday’s range and closed below Friday’s low. The has been follow-through selling today. The pattern was formed in March and the neckline, which we drew on the Great Graphic that was made on Bloomberg, is found at CAD1.28. The head peaked near CAD1.3125. Flipping it over at the neckline shows a measuring objective near CAD1.2475. The US dollar had rallied in February before forging the topping pattern. The neckline is roughly the 38.2% retracement of the February rally. The 50% retracement (~CAD1.2690) was met yesterday. Today’s low meets the 61.8% retracement near CAD1.2585. Several of the technical indicators we use are getting extended, but no sign of divergence or that a low is in place. The speculative community appears to have been caught leaning the wrong way. The net short position of nearly 32k contracts as of April 3 was the largest since last July. The gross short position of 61.4k contracts is the largest since then as well and has more than doubled since late February. The gross short position has fallen from nearly 80k contracts in late March to 29.6k contracts as of a week ago. |
CAD/BGN Currency, Oct 2017 - Mar 2018 |
The Bank of Canada meets next week. The OIS suggests there is about a one-in-five chance of a hike. The odds increase slightly for the May meeting, but the July meeting is favored for the next hike. The prospects for a NAFTA agreement may also be helping. While we suspect an agreement will be struck, this week may be a bit soon, even given the US compromise on domestic content rules.
The 60-day rolling correlation between the percent change of the US dollar against the Canadian dollar, and the S&P 500 is -nearly -0.50%. In the last three years, it has rarely been beyond -0.60. On a purely directional basis (conducting the correlation on levels rather than percentage change), the US dollar remains sensitive to the interest rate differential. Over the past 60 sessions, the correlation between the US-Canadian dollar and the two-year rate differential is near 0.87, up from a low below 0.20 in late February. The correlation with the 10-year differential is more stable, having largely held above 0.63 since last July. It is near 0.92 now.
Full story here Are you the author? Previous post See more for Next postTags: #USD,$CAD,Great Graphic,newslettersent


