


Joseph Y. Calhoun
My articles My siteAbout meMy videosMy books
Follow on:LinkedINTwitterSeeking AlphaAmazon
How quickly things change in these markets. In the report two weeks ago, the markets reflected a pretty obvious slowing in the global economy. In the course of two weeks, what seemed obvious has been quickly reversed. The 10-year yield moved up a quick 20 basis points in just a week, a rise in nominal growth expectations that was mostly about inflation fears. The economic news over the last two weeks does not appear to support the move in rates but our process puts more emphasis on markets and less on individual economic reports. So, I’ll accept that inflation fears – and fear of the Fed’s response – have driven rates higher over the last week. Whether those fears are warranted is open to question.
Even after the move up in rates, the overall outlook for the economy hasn’t changed much. Real interest rates are still stuck in the same range they’ve been in since mid-2013 and the nominal 10-year rate is within a similar range that has prevailed since 2011. Both though are right at the top of those ranges and the obvious question is whether rates will continue higher. Or to put it a little differently, is nominal growth – real growth plus inflation – about to move into a new, higher range?
While I can’t answer that question definitively, I do have my doubts. Every tightening cycle in my career has seen long-term rates peak at a lower level and I don’t think this one will be any different. The 10-year rate has already doubled from the lows, a bigger move than any tightening cycle in my career (and this is the fourth major one). It is tempting to say this time will be different because the Fed held short rates lower for longer this time than even the last cycle when that caused so many problems. But it seems to me that doing so makes the economy more sensitive to higher rates, not less. Debt levels are higher today, in the US and globally, than they were in the last cycle. Higher rates will bite sooner than they have in the past.
As for inflation, earnings reports and company calls indicate that companies are not able to pass through rising raw materials costs and that is hitting margins. That’s what drove the selloff in Caterpillar shares this week after a very good earnings report and it isn’t just one company having that problem.
Could interest keep rising? Obviously, the answer is yes but that depends on the economic data and how market participants interpret that data with respect to Fed policy. We’ve already seen some moderation in sentiment and in the regional Fed surveys. We get a durable goods report tomorrow and Q1 GDP Friday. Expectations are for growth of about 2%. Anything significantly different than that view will probably move markets.
Economic ReportsEconomic Growth & InvestmentIndustrial production, a measure of output of the nation’s factories, mines, utilities, and oil and gas fields, increased by a seasonally-adjusted 0.5% from the prior month. That was a bit better than expected, but the gains were led by utility and mining (oil drilling) output. Manufacturing, the biggest component of industrial production, was also higher for the month, but less than anticipated and down from the 1.5% gain the previous month. The Leading Economic Indicators fell back to 0.3%, mostly due to the recent weak payrolls report. Weakness in residential construction and stock prices also made a negative contribution. |
Economic Growth and Investment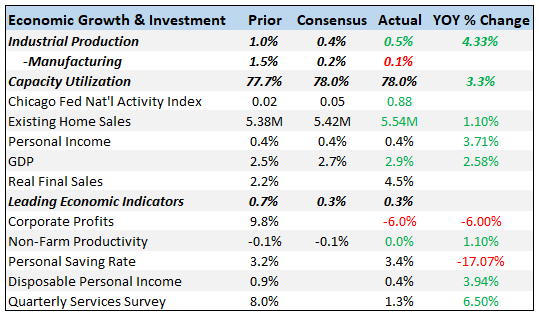 - Click to enlarge |
ProductionThe Empire State Manufacturing Survey came in less than expected, while the Philly Fed Survey beat but the details of each were surprisingly weak. 6-month expectations in the Empire report collapsed; general business conditions fell 25.8 points to 18.3, with similar declines for new orders and shipment. Perhaps a trade war effect but we really don’t know. The Philly Fed Survey current indicators paint a similar picture. New orders are down by just under half, and backlog orders down to 7.8 vs 20.1 last month. Shipments are also down 9 points to 23.9. The price index is also showing upward pressure, as price increases for purchased inputs came in at 59 vs 44 in March, while the “prices received” index also rose 9 points. Both these reports point to a slowing in coming months but I’d be careful extrapolating too much. These reports were very strong over the last year but the hard data never really reflected their strength. It may be the same in reverse but sentiment does matter so I’ll keep an eye on these moving forward. |
Production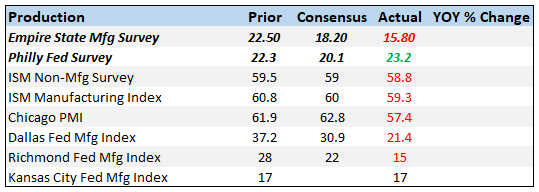 - Click to enlarge |
Consumption & DistributionRetail sales were stronger than expected, led by auto sales, up 2.0% in March. Once you remove Auto & Gas sales from the equation. the number is up only 0.3%; not bad, not great. If you dig deeper, you can see that department stores are still struggling (-0.3%), as are clothing stores (-0.8%). Building materials were also down -0.6%. |
Consumption and Distribution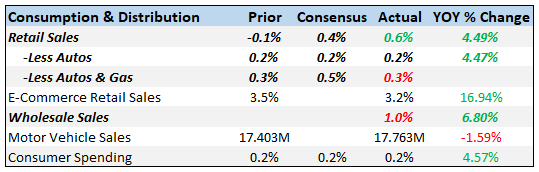 - Click to enlarge |
InventoriesInventories are going to add to Q1 GDP; the question is by how much. Inventory/sales ratios are still too high which makes you wonder if this inventory build is unintentional. |
Inventories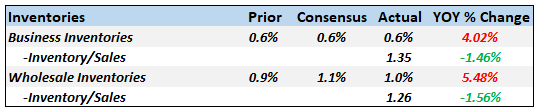 - Click to enlarge |
InflationCore CPI is now above 2%. Although the CPI was down this month, the drop was attributed to a 2.8% decline in the energy index. Expect that to be reversed next month as gas prices recently hit a three year high. The Producer Price Index saw steel and aluminum prices up significantly in advance of the tariffs. Given that the administration granted so many exceptions, those prices could reverse soon. It appears that steel and aluminum producers were able to extract higher prices over nothing but fear of tariffs. Year-over-year, the PPI is up 3.0%. As I’ve said before, I expect rising producer prices to hit margins and we’ve seen some of that in recent earnings reports, most notably Caterpillar. Import and export prices moderated in the month of March. This makes sense as the dollar stabilized and traded within a range last month. The dollar more recently has shown some strength so import and export prices may ease further. |
Inflation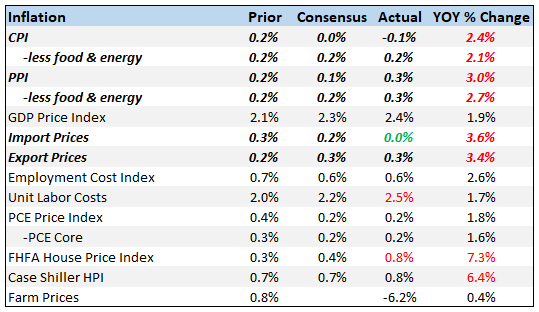 - Click to enlarge |
EmploymentNew applications for unemployment benefits were essentially flat in the last week, slightly worse than expected. Jobless claims seem to have stopped falling, but it’s too early to get concerned. We’ll begin to worry once the 4-week moving average turns positive year over year. The most recent reading was still 5.3% lower than last year. Job openings were down and less than expected but still up over 7% year over year. Hires were also down from last month but up 4.6% year over year. |
Employment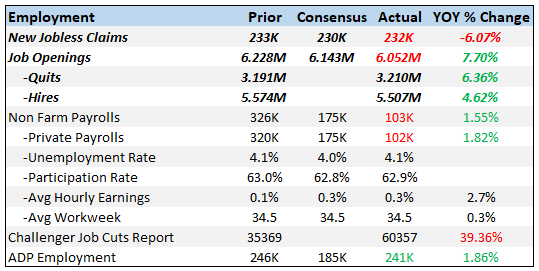 - Click to enlarge |
ConstructionHousing Starts, Permits, and the HMI were all fairly positive. Starts and permits were both better than expected, due primarily to a rebound in multi-family activity. Single-family starts, which account for the largest share of the housing market, fell 3.7% in March. Further, single family permits were also down (-5.5%) pointing to a potential slowing in the future. Having said that, these report are very volatile and the housing market seems pretty solid and will likely add to Q1 GDP. |
Construction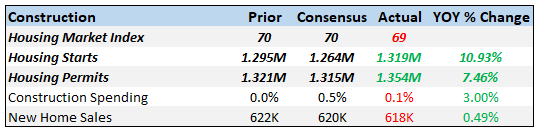 - Click to enlarge |
SentimentThe NFIB and Consumer Sentiment index both came in less than expected but are still at very high levels. Sentiment appears to be peaking. |
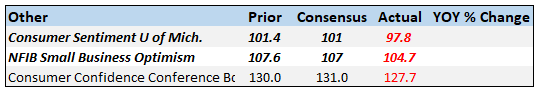 - Click to enlarge |
Market Indicators10-Year Treasury Note YieldThe 10 year Treasury yield jumped 20 basis points since the last update, The rise is mostly due to rising inflation expectations but real yields were up some too. Yields are now back to highs last seen in early 2014. |
US 10 Year Treasury Yield Index, Oct 2017 - Apr 2018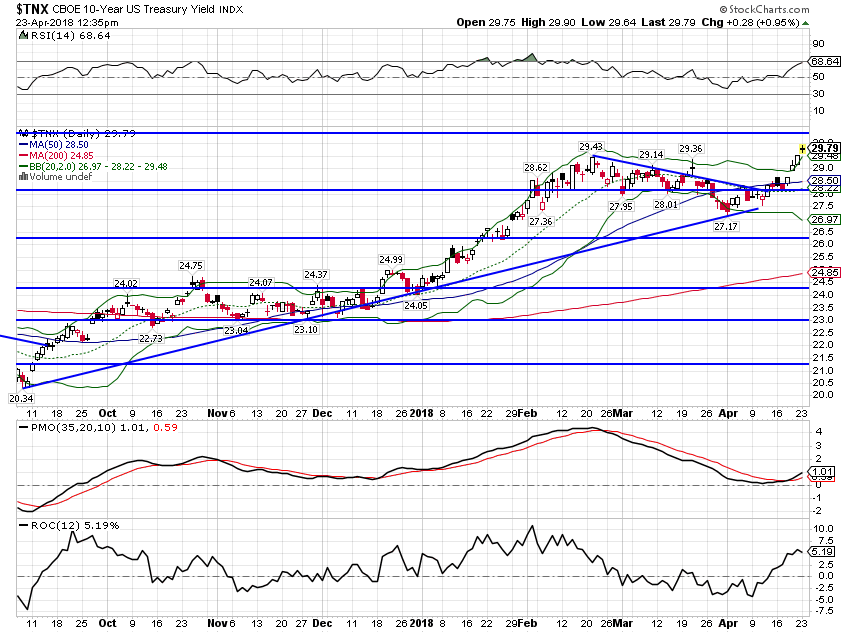 - Click to enlarge |
10-Year TIPS YieldThe 10-year TIPS yield is up about 9 basis points since the last update but is still stuck in the range that has prevailed since 2013. Once again, until this breaks out decisively, our expectations for real growth won’t change. |
Treasury Inflation - Indexed Security, Jul 2013 - Apr 2018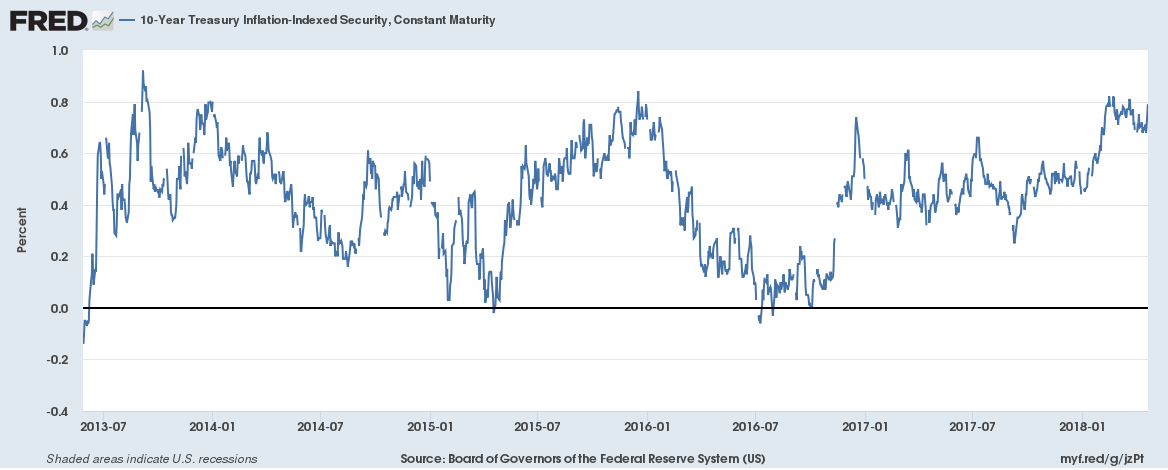 - Click to enlarge |
2-Year Treasury YieldThe 2-year has been on a tear since the last update, gaining about 17 basis points. The selling since the last update has been relentless and frankly a bit mysterious. There does not appear to be much in the way of news driving this except the apparent determination of the Fed to continue hiking rates. |
US Treasury Yield Index, Sep 2017 - Apr 2018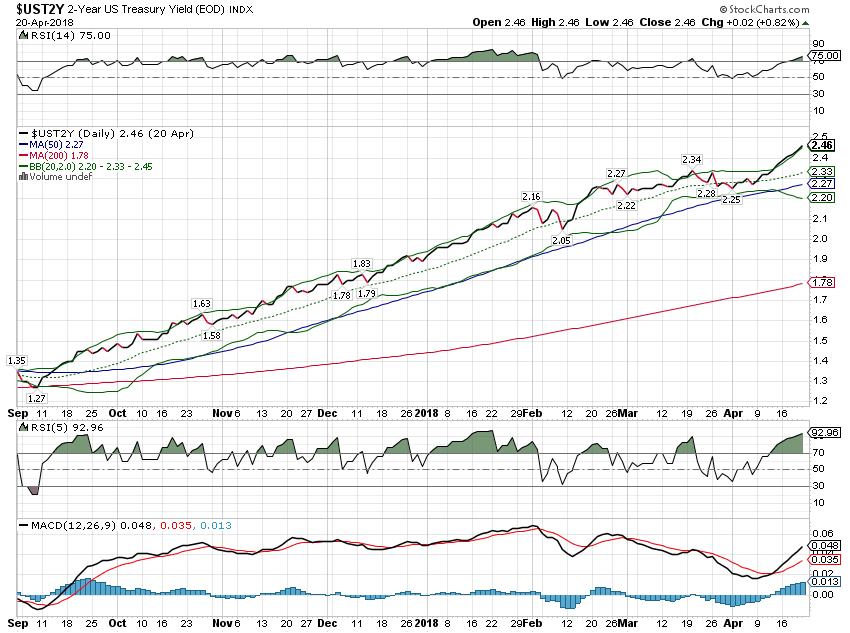 - Click to enlarge |
10/2 Yield CurveThe yield curve was basically unchanged since the last update as the 10 year moved higher with the 2 year. I wouldn’t read too much into this as the trend is still toward flattening. The curve had flattened more but steepened again as the 10 year sold off over the last week. This short term steepening is not the kind of action we see prior to recession. |
2 Year Bonds Yield Curve, Oct 2017 - Apr 2018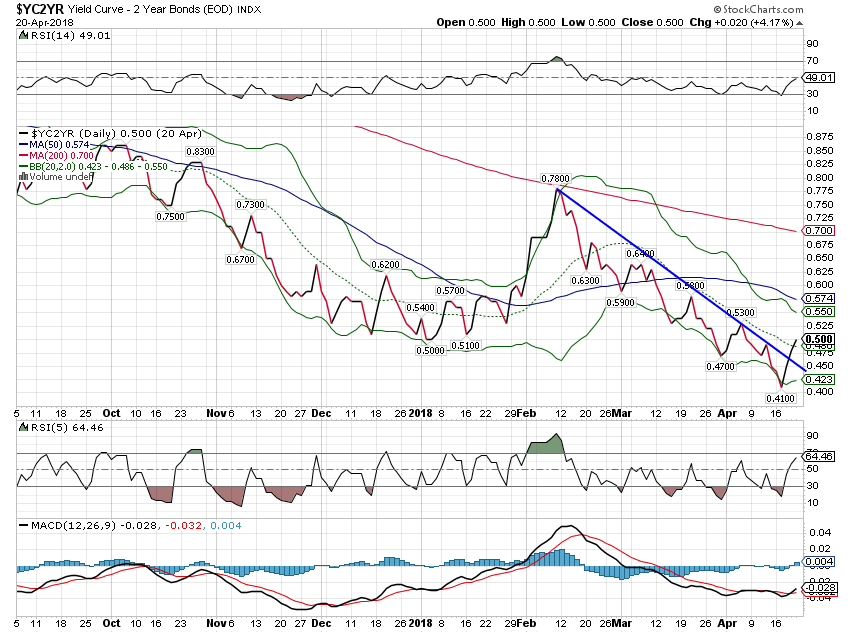 - Click to enlarge |
Credit SpreadsCredit spreads in the last two weeks have narrowed substantially, testing the low of 3.23% set on January 26 of this year. They currently sit just above the cycle-low, at 3.24. The action in spreads is somewhat odd given the action in stock markets. Stocks have been weak while spreads have narrowed, not what we would normally expect. Will spreads start to widen? Or will stocks find a bottom soon? |
US High Yield Master II Option-Adjusted Spread, Jan 2012 - 2018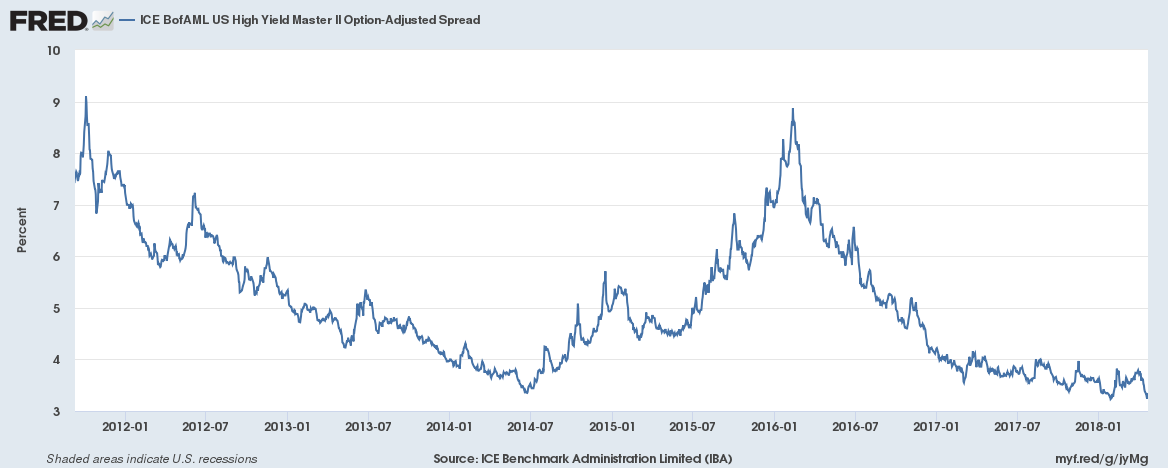 - Click to enlarge |
US DollarThe dollar finally found a bid and rallied over the last two weeks, responding to higher rates and rising nominal growth expectations. As I’ve written previously, this was expected but I don’t think it will change the trend. |
US Dollar Index, Jul 2017 - Apr 2018(see more posts on U.S. Dollar Index, )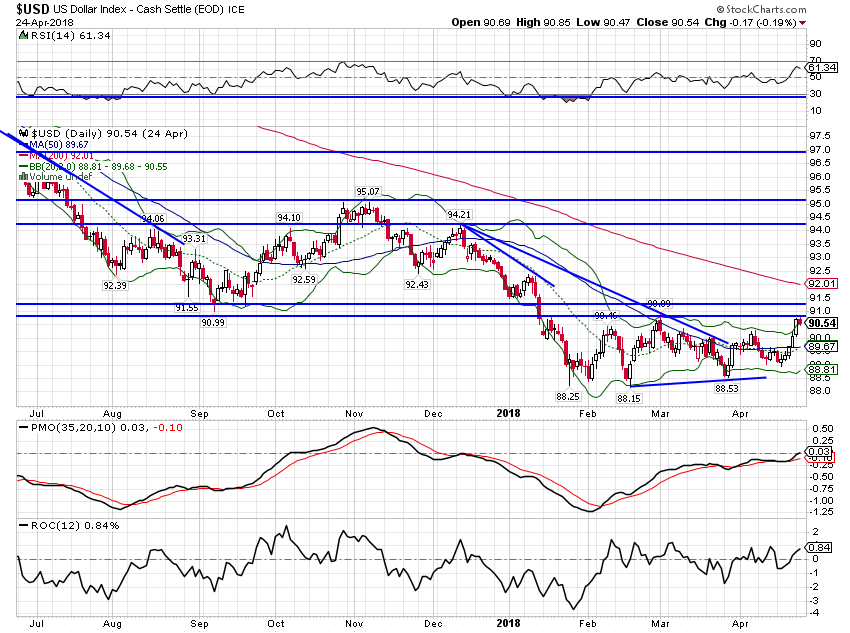 - Click to enlarge |
| The Trump administration has made it clear they prefer a weaker dollar and as long as that is true, I think upside is capped. The current rally faces stiff resistance at around 91.5.
The Euro has met resistance at the 200-month moving average. |
Euro - Philadelphia Index, 1999 - 2018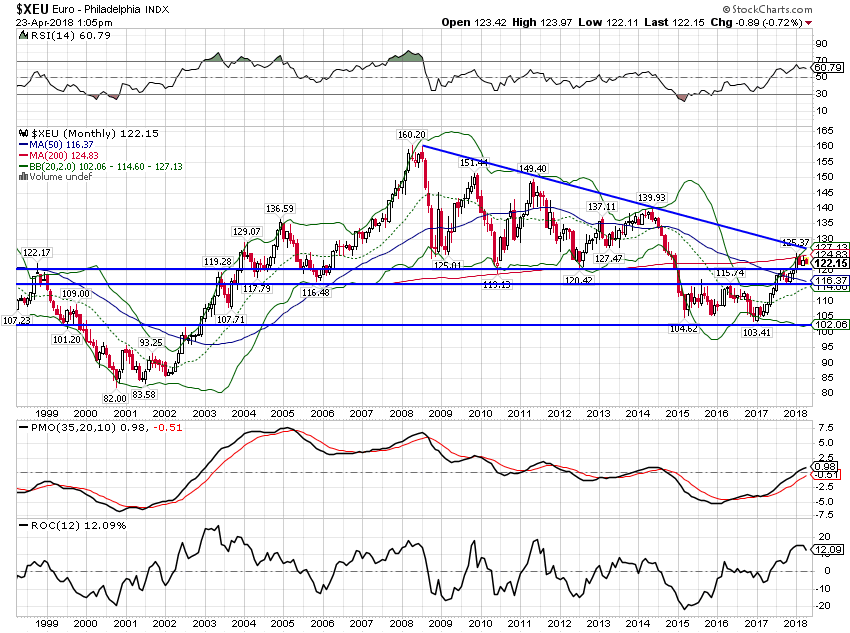 - Click to enlarge |
CommoditiesCommodities predictably performed poorly during the dollar rally. Gold was down but longer term measures of momentum point to further gains. That will probably require the dollar to resume its downtrend. The rise in rates and the dollar index as well as the fall in gold are a reflection of the short-term change in nominal growth expectations (mostly inflation).
|
Gold Daily, Oct 2017 - Apr 2018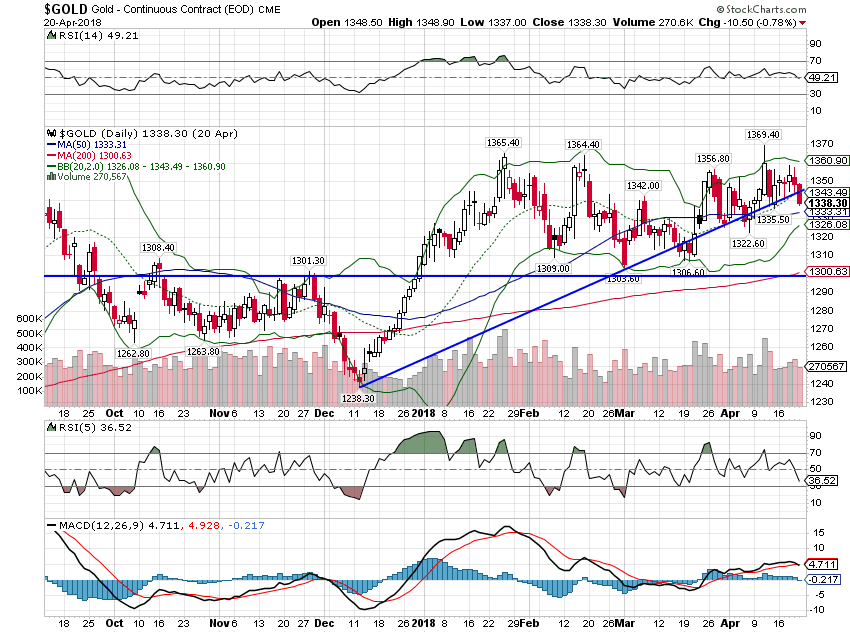 - Click to enlarge |
| The general commodity index also pulled back but technically looks better than gold. That, again, could be about growth expectations but it is also about the trade tiffs. Industrial metals prices in particular have been very volatile as companies try to figure out the impact of tariffs. There is definitely some hoarding of aluminum and steel going on which has acted to support prices.
From a longer term perspective, I continue to see momentum shifting to real assets including commodities. |
Bloomberg Commodity Index, Oct 2017 - Apr 2018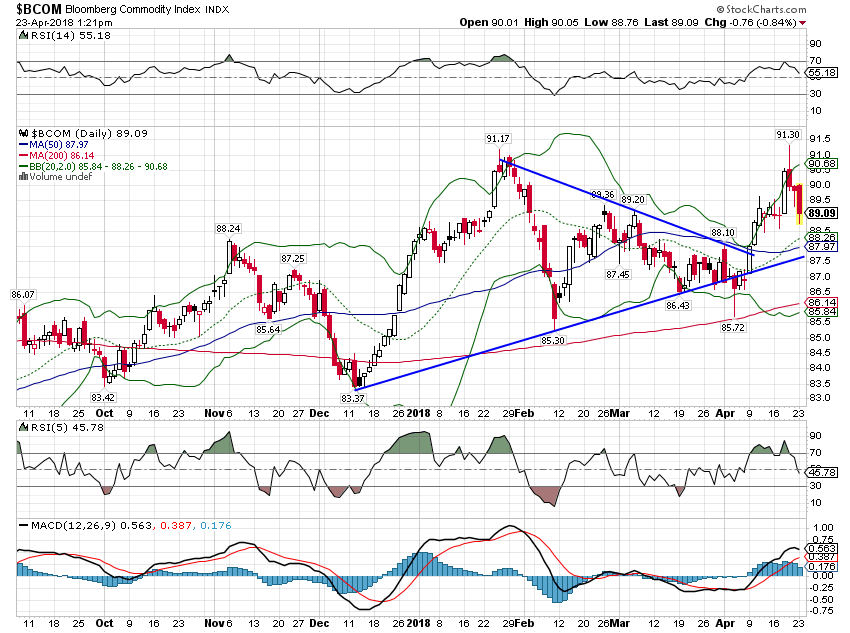 - Click to enlarge |
| The rise in interest rates has been mirrored by the rise in the copper/gold ratio. However, the gap between this ratio and interest rates has widened to a level that is not sustainable. We are either about to boom and copper prices take off or interest rates will pull back. Given the information provided by the Empire State and Philly Fed surveys (along with the Richmond Fed report which came out yesterday and printed negative for the first time since September 2016), the latter seems more likely. |
Copper:Gold Monthly, 2006 - 2018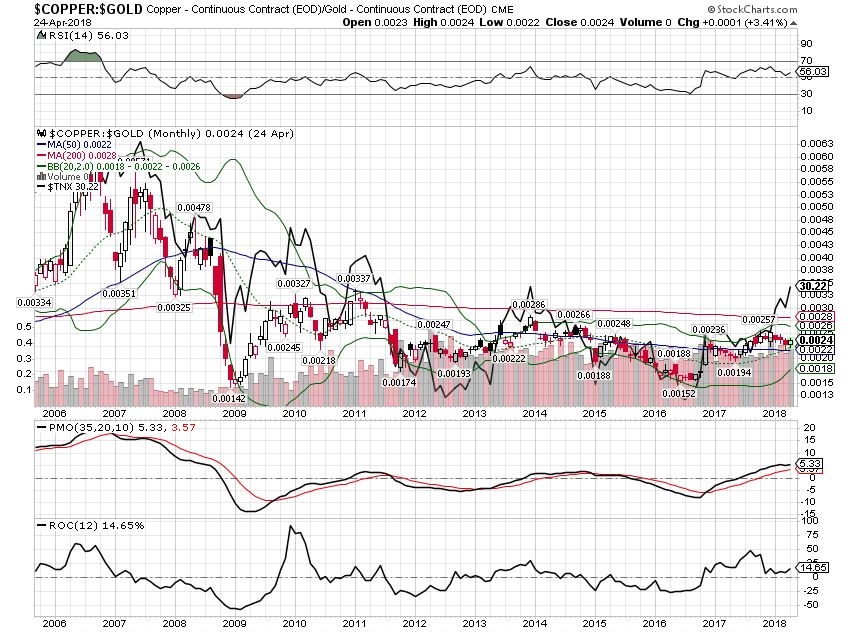 - Click to enlarge |
Growth and inflation expectations have risen somewhat since my last report. Still, for now, my view hasn’t changed. The US economy is growing roughly at the trend of 2% and I see no reason – so far – to think that has changed. The economic data has certainly not given us any reason to get more bullish about growth. I suppose inflation could be a problem but higher rates should naturally slow a heavily indebted economy. If rates continue rising, I will have to change my view but there isn’t sufficient evidence to do so yet.
Tags: 10 year treasury yield,Alhambra Research,Bi-Weekly Economic Review,Bonds,commodities,credit spreads,currencies,economy,Federal Reserve/Monetary Policy,Gold,Housing market,inflation,Interest rates,jolts,Market Sentiment,Markets,newslettersent,Retail sales,TIPS,U.S. Dollar Index,US dollar,Yield Curve


