WhipsawedFrank Roellinger has updated us with respect to the signals given by his Modified Ned Davis Method (MDM) in the course of the recent market correction. The MDM is a purely technical trading system designed for position-trading the Russell 2000 index, both long and short (for details and additional color see The Modified Davis Method and Reader Question on the Modified Ned Davis Method). |
|
| As it turns out, the system was whipsawed, which is not a big surprise, as it attempts to minimize drawdowns (and it succeeds quite well at this task). Frank writes:
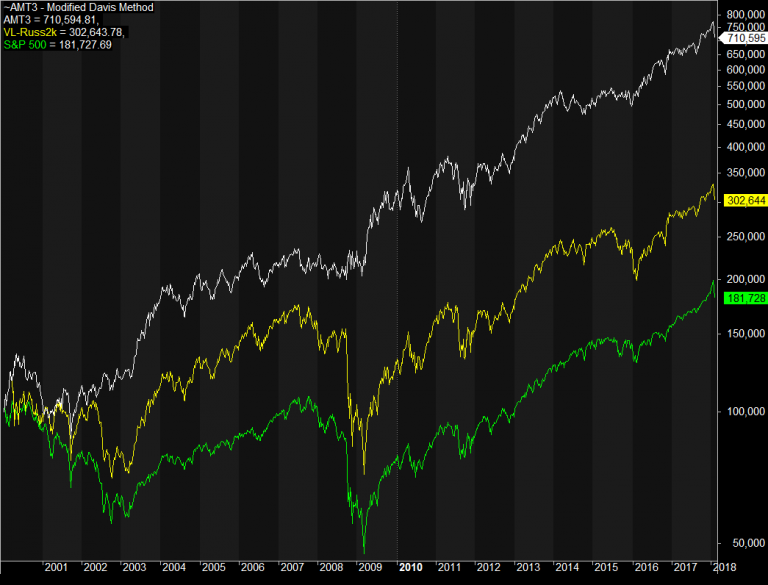
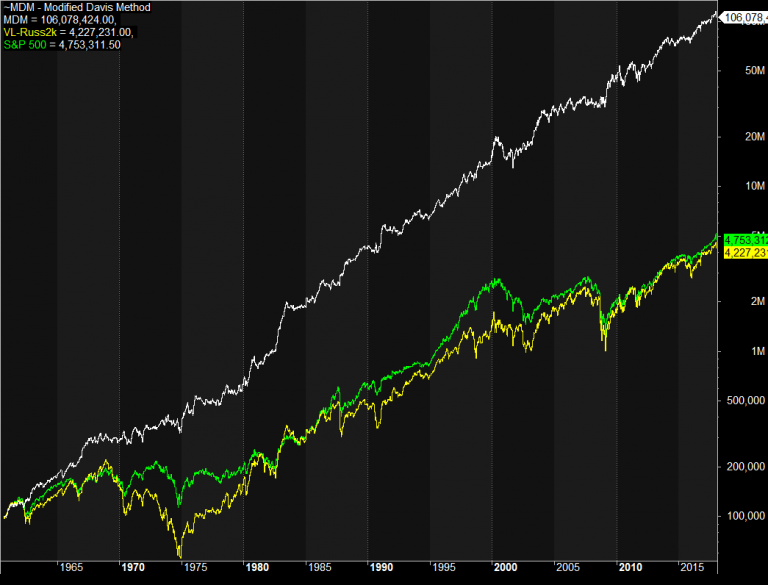
Frank also sent us two updated charts comparing the cumulative return of the MDM to that of the Russell 2000 and the S&P 500 Index in the medium term (starting in 2000) and the long term (starting in 1960). |
Cumulative return of the MDM, Russel 2000 Index and S&P 500 Index, 2000 - 2018(see more posts on S&P 500 Index, ) |
| We are not surprised he isn’t overly concerned with fundamental rationalizations. 🙂 |
Cumulative return of the MDM, Russel 2000 Index and S&P 500 Index, 1965 - 2018(see more posts on S&P 500 Index, ) |
A General Remark
We would note that these charts illustrate rather dramatically what a big difference avoiding large drawdowns makes with respect to long-term returns. The buy and hold mantra espoused by some people strikes us as absurd in light of these mathematical certainties. Even a very simple system (such as e.g. using the 200 dma as a demarcation for when to be in or out of a market) is better than having no system at all – despite the occasional whipsaw danger.
As an example of the potential pitfalls of the “buy & hold” approach, consider the stock market of Cyprus (n.b., this is a developed EU member nation). Someone who bought the market at its 2007 peak and decided to simply hold when it started to decline, would eventually have incurred a 99.29% paper loss over the next nine years (a decline from 5,676 points to 40 points based on the Main Index – in terms of the no longer existing Dow Jones Cyprus index, it would have been even worse). Let us assume that this market had subsequently rallied by 1,000% from its low. At that point, our hypothetical investor would “only” be down by 92.17% from his entry price. Hallelujah!
Admittedly, this is probably the most extreme example in the history of financial markets (leaving aside completely non-recoverable situations such as Dutch tulips), but it happened just a few years ago in a country that is a member of both the EU and euro zone. By the way – that 1,000% recovery? It was unfortunately just as hypothetical as our above mentioned buy & hold investor, i.e., it never happened. The stock market of Cyprus just retested its December 2016 all time lows in December of 2017. It is up a rather meager 6% since then.
Anyway, the point stands even for markets in which such a severe decline is considered unlikely. Keep in mind that a 50% drawdown requires a 100% rally just to return to break-even. That is not always an easy task – for example, Japan’s Nikkei remains some 45% below the ATH it put in almost three decades ago. After the peak of the tech mania in 2000, the Nasdaq Composite fell by 80% and took 16 years to regain its former high.
Since most of the stocks in the index pay no dividend, a buy & hold investor had no other means of catching up than to wait for Ben Bernanke’s printathon magic. And of course that break-even was merely in nominal terms. We don’t recall any WS analysts recommending to sell anywhere near the 2000 peak (on the contrary!). Conclusion: it is far better to have a system.
Full story here Are you the author? Previous post See more for Next postTags: newslettersent,On Economy,S&P 500 Index,The Stock Market


