George Dorgan
My articles My siteAbout meMy videosMy books
Follow on:LinkedINTwitterSeeking Alpha
CFA SocietyEconomicBlogs
We do not like Purchasing Power or Real Effective Exchange Rate (REER) as measurement for currencies. For us, the trade balance decides if a currency is overvalued. Only the trade balance can express productivity gains, while the REER assumes constant productivity in comparison to trade partners.
Who has read Michael Pettis, knows that a rising trade surplus may also be caused by a higher savings rate while the trade partners decided to spend more. This is partially true.
Recently Europeans started to increase their savings rate, while Americans reduced it. This has led to a rising trade and current surplus for the Europeans.
But also to a massive Swiss trade surplus with the United States, that lifted Switzerland on the U.S. currency manipulation watch list.
To control the trade balance against this “savings effect”, economists may look at imports. When imports are rising at the same pace as GDP or consumption, then there is no such “savings effect”.
After the record trade surpluses, the Swiss economy may have turned around: consumption and imports are finally rising more than in 2015 and early 2016. In March the trade surplus got bigger again, still shy of the records in 2016.
Swiss National Bank wants to keep non-profitable sectors alive
Swiss exports are moving more and more toward higher value sectors: away from watches, jewelry and manufacturing towards chemicals and pharmaceuticals. With currency interventions, the SNB is trying to keep sectors alive, that would not survive without interventions.
At the same time, importers keep the currency gains of imported goods and return little to the consumer. This tendency is accentuated by the SNB, that makes the franc weaker.
Texts and Charts from the Swiss customs data release (translated from French).
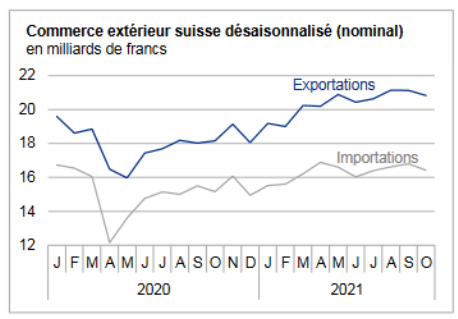
Exports and Imports YoY DevelopmentAlthough exports fell in January 2018 from the December peak, their trend remains upward. Imports, for their part, began the year with fanfare to sign a record result. In both traffic directions, chemicals and pharmaceuticals made rain and shine. ▲ Second best month for exports ▲ Exports to China exceed CHF 1 billion for the third time ▲ North American imports: 13% above their previous record |
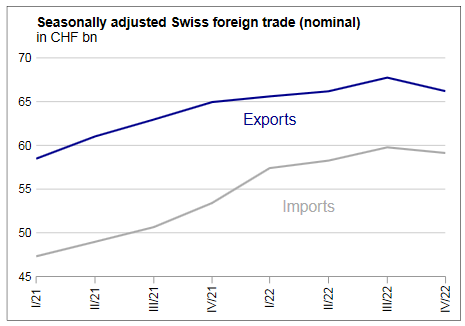
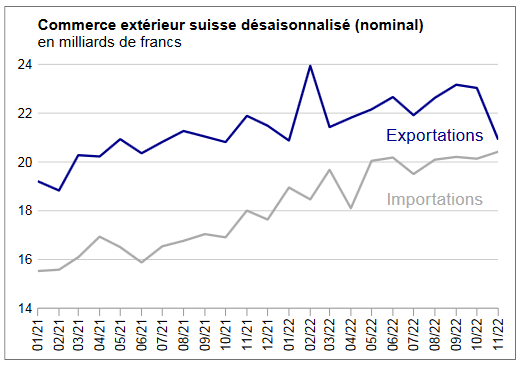
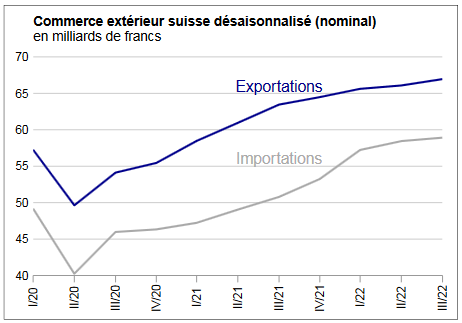
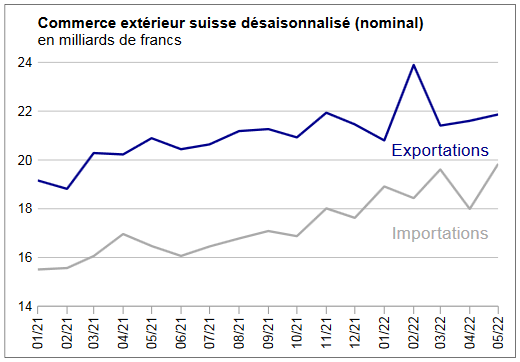
Swiss exports and imports, seasonally adjusted (in bn CHF), January 2018(see more posts on Switzerland Exports, Switzerland Imports, )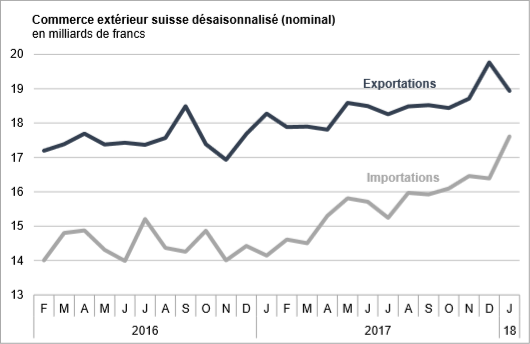 Source: Swiss Customs - Click to enlarge |
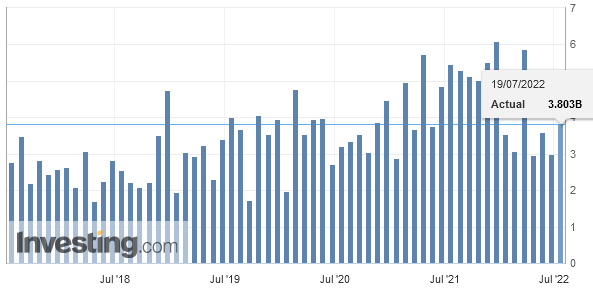
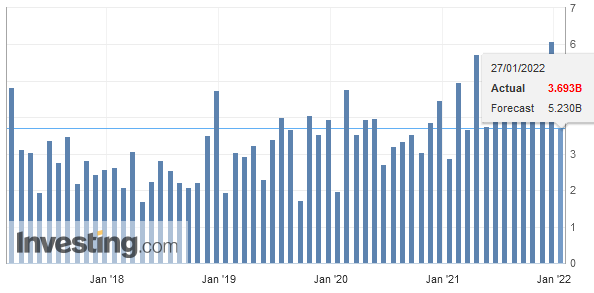
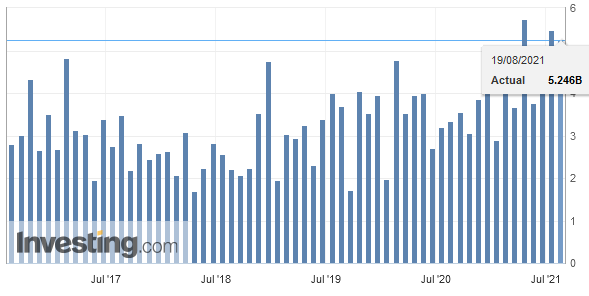
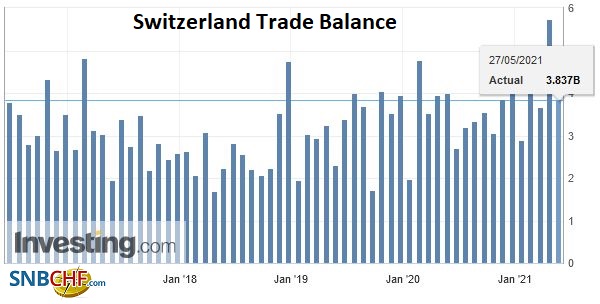
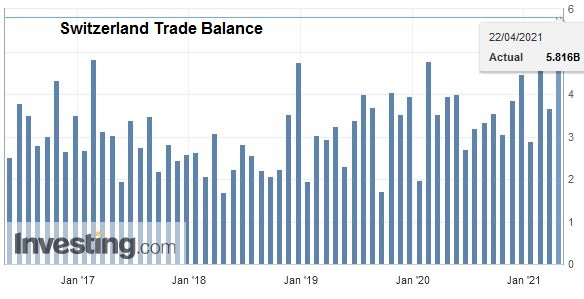
Overall evolutionAfter the jump in December 2017, exports dipped in January 2018 on a seasonally adjusted basis (-4.2%, real: -5.1%). Nevertheless, they continued on their way to record their second best result. For their part, imports rose 7.5% (real: + 3.8%) and set a monthly record. The positive trend, which has been going on since the end of 2016, is clearly confirmed. In the trade balance, the opposite trend between exits and inflows leads to the smallest surplus (1323 million francs) since January 2012. |
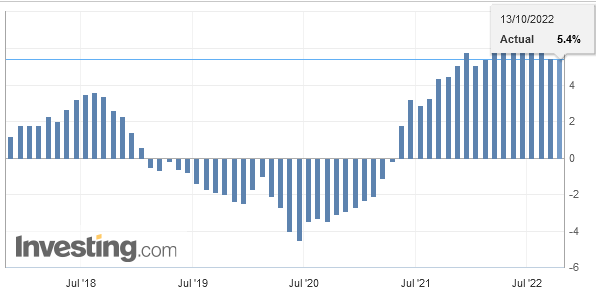
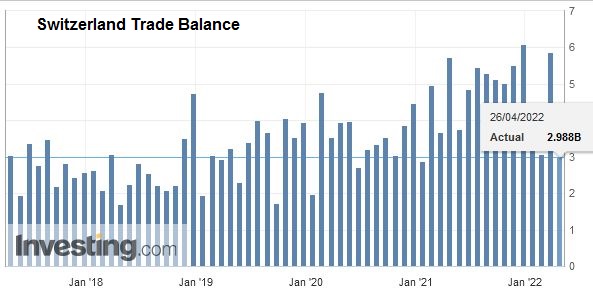
Switzerland Trade Balance, Jan 2018(see more posts on Switzerland Trade Balance, )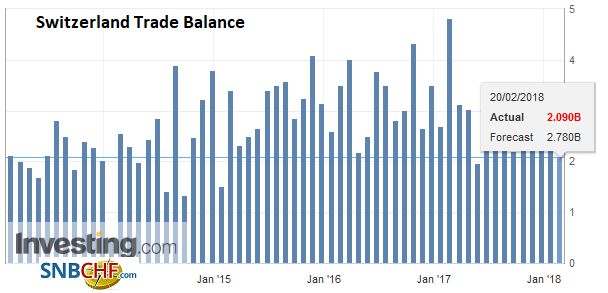 Source: Investing.com - Click to enlarge |
ExportsExports: watchmaking on a rising waveOn export, the main groups – except watchmaking – failed to confirm the good results of the previous month and showed a decline in January 2018. Heavyweight export, chemicals and pharmaceuticals fell 5.3% or 467 million francs in one month, or half of the total decrease. Drug sales suffered particularly (-309 million francs). Despite declining deliveries, precision instruments and the machinery and electronics sector continue to show a good trend. Among the other groups, the plummet of jewelery did not go unnoticed (-130 million). Progressing by 4.1% over one month, watchmaking saw its dynamism strengthen over the last few months. Negative signs were also legion in January 2018 at the geographical level. Among the three main continents, North America lost 7.6% (USA: -248 million francs) and Europe 4.9%. While exports to Asia stagnated over a month (+ 0.3%), they nonetheless establish a historic result. On the European continent, Austria (-14.4%), Belgium, France and Italy were particularly shaken. In Asia, the jump to Japan and China contrasted with the fall towards the Middle East (jewelery). For the third time in their history, sales to China exceeded the one billion mark. |
Swiss Exports per Sector January 2018 vs. 2017(see more posts on Switzerland Export, Switzerland Exports by Sector, )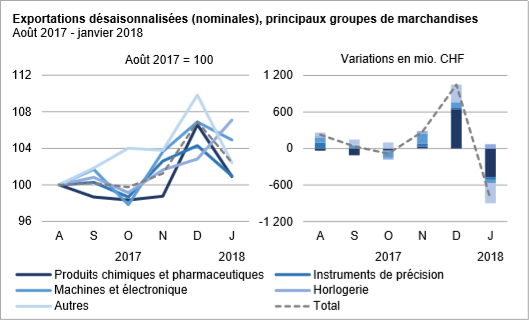 Exports by commodity roup: Nominal variations corrected for days working compared to January 2017 Source: Source: Swiss Customs - Click to enlarge |
ImportsImports: 90% of growth on behalf of chemistry-pharmaIn January 2018, and in seasonally adjusted terms, three of the four largest commodity groups posted a one-month increase. After the sluggish last five months, chemicals and pharmaceuticals had a good month with + 29.8%. They alone generated 90% of total growth. Among them, the active ingredients were highlighted (+469 million francs). Further, the vehicles were not left behind (+194 million), boosted by imports of several airliners. Even though the machinery and electronics sector has stagnated and metals receded, both remain on their uptrend in recent months. The dynamism of imports gained ground in North America (+ 31.4%, USA: +436 million francs) and especially in Europe (+ 8.8%). Asia, the second largest supplier, dropped 7.2% in one month. In terms of records, North America has pulverized its former summit of 200 million francs. On the European continent, Ireland, the United Kingdom and Austria stand out: this trio generated 977 million francs in additional inflows (pharma), benefiting, however, from a favorable base effect (month of weak December). In Asia, the United Arab Emirates (-326 million, jewelery) and Singapore (+106 million) crossed the line. |
Swiss Imports per Sector January 2018 vs. 2017(see more posts on Switzerland Imports, Switzerland Imports by Sector, )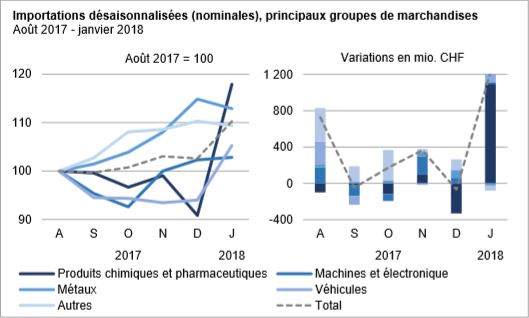 Imports by commodity group: Nominal variations corrected for days working compared to January 2017 Source: Swiss Customs - Click to enlarge |
Full story here Are you the author?
Tags: newslettersent,Switzerland Export,Switzerland Exports,Switzerland Exports by Sector,Switzerland Imports,Switzerland Imports by Sector,Switzerland Trade Balance