Summary:
S&P 500 stalled near 61.8% retracement of decline.
Dow Jones Stoxx 600 stopped at 38.2% retracement.
U.S. corporate earnings growth has been much more impressive than that of Europe.
The different performance does not appear to be a function of FX rates.
| Today is an important day for equities. After a sharp sell-off earlier this month, stocks staged a recovery last week. The recovery has stalled near retracement objectives, which could be a potential turning point in the market.
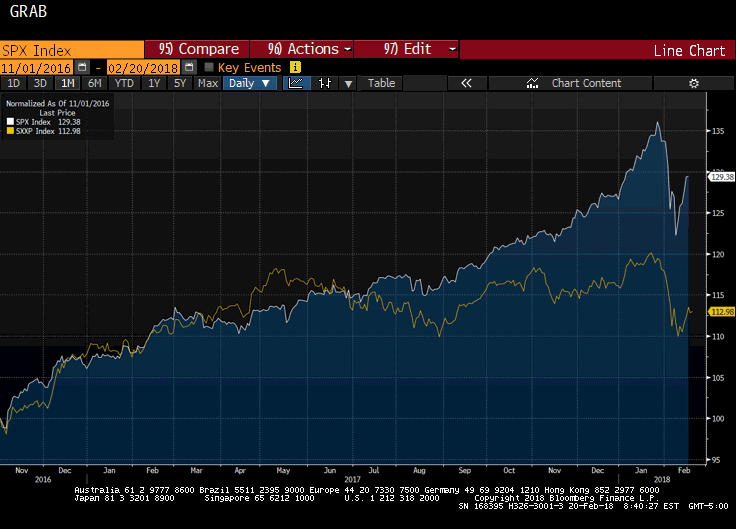
The Dow Jones Stoxx 600 peaked on January 23 and dropped about 9% through February 9. Through yesterday, it recovered 38.2% of its decline, poking a little above 381.00. The S&P 500 peaked a few days after the Stoxx 600 on January 26. It fell about around 11.8% and bottomed on February 9. At the pre-weekend high, it retraced a little more than 61.8% of its losses, but settled just below the retracement objective (~2743). The Great Graphic shows the S&P 500 (white line) and the Stoxx 600 (yellow line) since the eve of the US 2016 election. The two-time series have been indexed to begin at 100. Over this period the S&P 500 has gained more than twice the Euro Stoxx 600 (29.4% to 13%). Look at the period since 2009. The US economy has grown at a 2.2% average in the 2010-2017 period. Germany has grown 1.9% and France 1.3%. The S&P 500 has averaged 11.6% annual gains over the period. The Stoxx 50 (for which Germany and France account for more than 2/3 of the companies and market cap) rose by an average of 2.1% per annum. S&P 500 earnings have grown by 9.7% a year from 2010 through 2017. Given US inflation, the earnings growth is about 8% per year in real terms. Since 1871, US average earnings growth is about 4%, or four times the economy’s real growth rate. The companies in the Stoxx 50 have seen their revenues decline by 1.3% annually from 2010 through 2017. They managed to show positive earnings growth (0.3% per year) due to cost cutting. The Great Financial Crisis played out differently on the Continent from the US experience. The US economy contracted in 2008 (-0.3%) and 2009 (-2.8%). The eurozone contracted in 2009 (-4.5%) and again in 2012 (-0.9%) and 2013 (-0.2%). The second contraction in the growth seems to have been sparked by the disruption spurred by the peripheral debt crisis. This may have contributed to the under-performance of European benchmarks., but there seems to be something more profound taking place as well. Some observers suggest a weaker dollar is good for US stocks. It sounds reasonable and intuitive. The only problem is the facts. Over the 2010-2017 period, the US dollar on a trade-weighted basis rose in all but two of the years for a cumulative gain of more than 16%. On a trade-weighted basis, the euro has fallen half the time (four of eight years) for a cumulative loss of 7.8%. |
SPX Index, Nov 2016 - Feb 2018 |
Tags: #USD,$EUR,Great Graphic,newslettersent,SPY


