Beginning of Post: See the introduction and the video for the terms gold basis, co-basis, backwardation and contango.
Questions and AnswersA reader emailed us, to ask a few pointed questions. Paraphrasing, they are:
He also added:
|
|
| That number, again, is 1-800-GOT-GOLD!
Just kidding. Thank you, sir, for your kind words and now let’s address your questions. First, we have a general response. It is good to know the truth, for its own sake, even if there is no immediate or obvious practical benefit. The world works a certain way and, speaking for ourselves, we want to know what that way is. As they say, knowledge is power. This is doubly so with gold, where there is so much misinformation, disinformation, and rubbish economics. Some of it is mainstream, such as the quantity theory of money. Some of it is unique to the gold market, such as allegations of manipulation. Perhaps this particular set of truths about the gold market is of interest only to gold theorists. We are gold theorists, so it is of interest to us. Gold theorists number among our readers, too. But we argue that this particular set of truths should be of interest to everyone. The greatest danger of our era is the coming monetary collapse. It is the inevitable consequence of irredeemable currency, exponentially rising debt, and falling interest. Many know that gold is part of the solution, but how? Is it just something one buys, as a speculation, to sell when its price rises? We believe that gold is much more than that. And we argue that the belief that one must speculate to increase purchasing power is an inevitable consequence of the Fed’s war on interest. Deprived of the ability to get a reasonable yield, people turn to speculation as a surrogate. The economic effects of investing for yield are opposite to those of speculating for capital gains. In the former, you finance an increase in production and your return comes from some of that increase. In the latter, you give your capital to a previous speculator who is exiting, and your gain comes from the next speculator handing his capital to you. Speculation converts someone’s wealth into someone else’s income, to be spent. It is a process of eating the seed corn, as we discuss in this series on Yield Purchasing Power. This is one reason why we insist that gold is money, and one must calculate the value of the dollar in gold terms (i.e., 24.3 milligrams) rather than the value of gold in dollars (i.e., $1,280/oz).The lighthouse does not move higher and lower, the steel meter stick does not get longer and shorter, and gold does not go up and down. It’s the sinking boat in the storm, the rubber band, and the dollar which move.
|
 Irving Fisher came up with the tautological equation (incl. “velocity” fudge factor) the quantity theory of money is based on. - Click to enlarge Now, Fisher came up with a lot of nonsense in his time (we have to thank him for the consumer price index as well, for instance), much of it for the purpose of making government meddling in the economy more “scientific” (evidence amassed since then strongly suggests the endeavor failed rather spectacularly). As someone once said – we are paraphrasing, and really don’t recall who it was, but it’s a worthwhile observation: “All of US modern mainstream economics is like a thin film of dust laid atop Fisher”. When studying Fisher’s work, one soon realizes that this is sadly quite true. Nevertheless, the quantity of money, and particularly changes in its quantity, as such shouldn’t be dismissed as unimportant. We hold with Hayek, who remarked that everyone needed to be aware of the quantity theory, and then should immediately forget about it again. As to gold manipulation, it should be mentioned that Deutsche Bank was caught manipulating the London gold and silver fix for years and paid a fine of USD 100 million to settle the case. But this was not different from the type of manipulation found in virtually all financial markets – usually very short term oriented and aimed at influencing benchmark data used as the basis for settlement of either otc or listed financial contracts. The same happened in LIBOR, and is a widely acknowledged fact of life in listed options markets as well (the so-called “maximum pain” phenomenon). This mundane reality is a lot less exciting than stories about a giant and all-encompassing conspiracy. Primary trends cannot be altered by such short term manipulation efforts– which is not to say that they should be ignored or condoned. [PT]. |
The Backwardation ThreatAnother is that only with this understanding can one grasp other phenomena. For example, the sputtering and slow withdrawal of the gold bid on the dollar. In all markets in all places and times, there is a principle that the bid can withdraw in times of stress or crisis. It is never the offer that withdraws, but the bid. For example, we often ask what if the US Geological Survey said there will soon be an earthquake in Los Angeles, 15 on the Richter Scale? There will be many offers to sell real estate in LA. But no bid, probably from Santiago, Chile to Vancouver British Columbia, and as far east as the Mississippi River. If one thinks that the dollar is money, and gold is a commodity, how to explain backwardation? Is it the one exception, where the offer to sell something is withdrawn while the bid is robust? What is one to make of gold backwardation (when the co-basis > 0)? Only with a clear picture, i.e., that gold is money and the dollar is credit paper, can one see that gold backwardation is serious business. It is an early harbinger of the end of our monetary era. By this, we do not mean: there will be a recession, stock market correction, or inflation (rising consumer prices). When the capital of an enterprise has been siphoned off over a period of decades, and debt is racked up beyond all means or intent to repay, and finally the inevitable default on the bond occurs, the price of that bond can go to zero. This is not a price of gold of infinity, but a price of the dollar of zero. But, to paraphrase our old friend Aragorn, today is not that day! In the meantime, the dollar is strong. And it has been getting stronger since early September (when it was 23.1mg gold). On to the practical reasons to follow the gold basis and Monetary Metals research. As our reader noted, we often show what happened. We see two benefits to this. One, if you know that a bunch of speculators jumped on a Fed announcement with leverage, you know not to pile in after the gold price has blipped up $20. You know it is unlikely to be a durable move. Two, you may even fade the move. The Monetary Metals Supply and Demand Report is not a trading letter. At the core, it shows a picture of, well, supply and demand conditions in the gold and silver markets. Occasionally, we will note that a metal seems underpriced, or alternatively, we may say caveat emptor. On our site, we publish graphs of our calculated premium or discount on gold and silver . While we do not say “buy here” and “sell there”, we provide a unique data set and view, not available anywhere else, to help inform traders. The basis provides actionable trading information, even if we don’t spell it out, and we use it to trade our Gold Exponential Fund. Can we prove that readers have benefited over the past 4 years? No, and yes. No, because we don’t call trades. So we cannot tabulate simple results. But yes, because we preserve everything we have written going back to the launch of our website in January 2013. Between public and premium (free, but requires registration) Supply and Demand Reports, you can go back to see what we were saying and when we said it. For example, in July 2016 the price of silver seemed to be on a tear. It went from around $14 at the beginning of the year, to over $20. |
|
| What did your favorite silver analyst say at the time? We said many things along the way, but let’s bracket the move. At the start, on January 31, 2016, we titled our Report A Possible Sign of Silver Turn. We said:
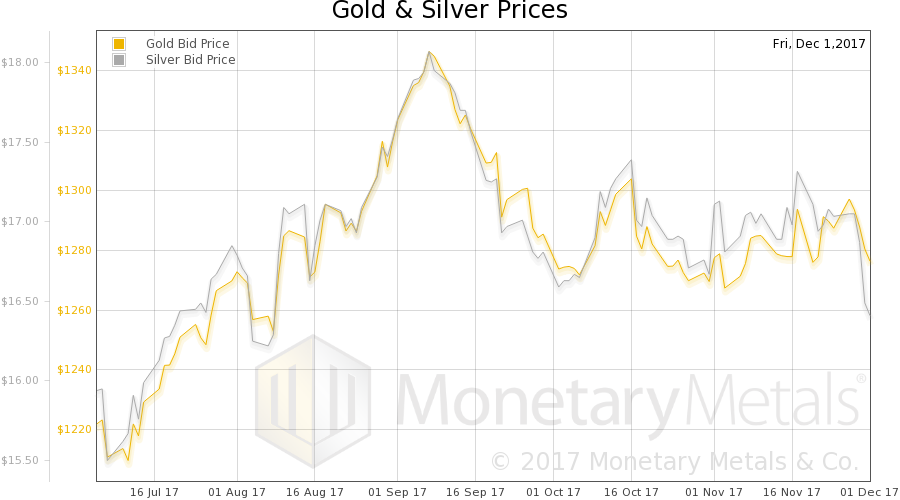
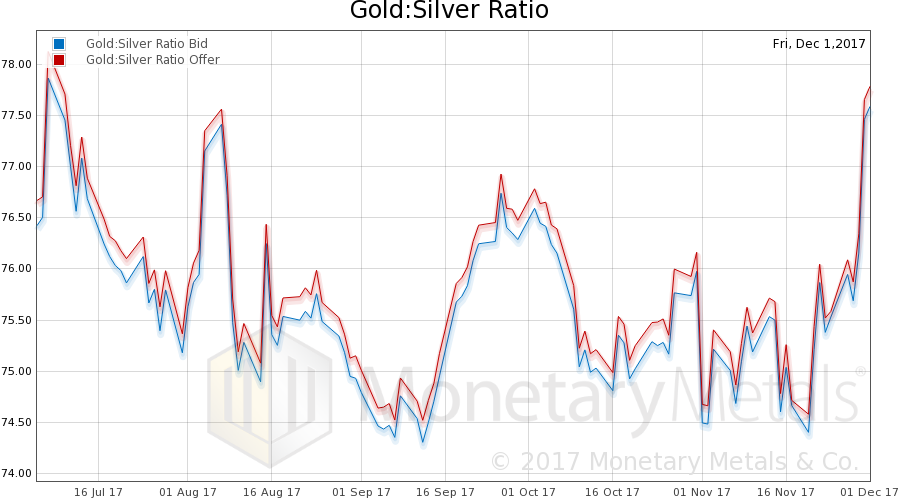
At the end of the move, on July 3, 2016 we said that our calculated fundamental price was about $3 under the market price. We encourage readers to go through the archives. Our policy is to preserve the record of every article we published. As we recall, at every price blip there were many analysts saying to buy before the metals shoot up to the moon. Perhaps we should be thankful for bitcoin, in that some of the most hyperbolic hyper-ventilators have moved to this exciting new speculative market. If we were to do a standard business SWOT analysis (Strengths, Weaknesses, Opportunities, and Threats) for the gold brand name, we would have to say that the biggest weakness is the snake oil salesmen and the rubbish economics they push. They come out most especially when the price has blipped, when they know many people are likely to be excited and excitable. We publish daily charts and a weekly Report to show an honest look at the market conditions. The next time someone tells you that demand for physical metal is off the charts, but they are selling paper gold by the billions, you have the data to know if it’s true. To conclude, the monetary system is moving inexorably towards Armageddon. There is no single better indicator than the gold basis. Right now, the near contract basis is +0.83%. Armageddon is not imminent. Today is not that day. Fundamental DevelopmentsThe prices of gold and silver dropped $7 and $0.61 respectively last week. This means the gold-silver ratio jumped up, from 75.64 to 78.03. We have been calculating a fundamental value of the ratio above the market value from the end of July, though it dipped in November. This week, both the market and fundamental ratio rose with a vengeance. We will discuss the fundamentals and how they changed this week. But first, here are the charts of the prices of gold and silver, and the gold-silver ratio. |
Gold and Silver Price(see more posts on gold price, silver price, ) |
Gold:Silver RatioNext, this is a graph of the gold price measured in silver, otherwise known as the gold to silver ratio. The ratio rose sharply.
|
Gold:Silver Ratio(see more posts on gold silver ratio, ) |
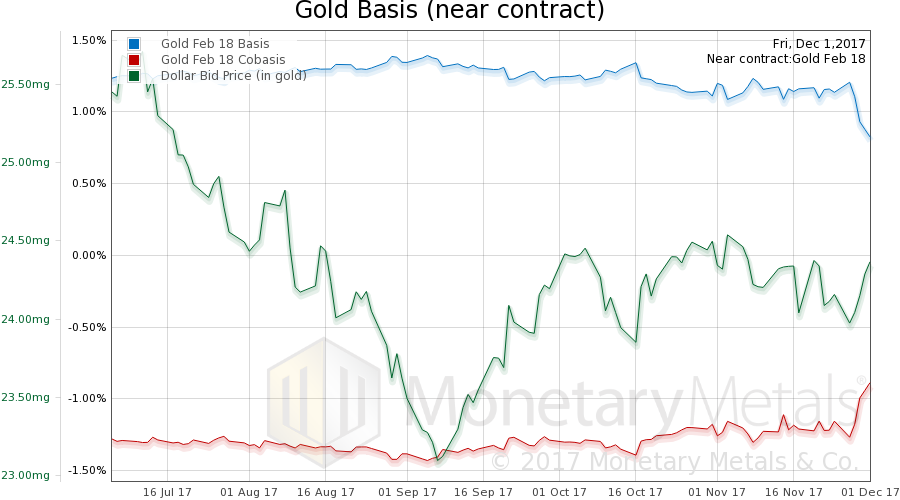
Gold Basis and Co-basis and the Dollar PriceHere is the gold graph showing gold basis and co-basis with the price of the dollar in gold terms. The co-basis (our measure of scarcity) broke out, rising noticeably, as the price of gold fell slightly. The Monetary Metals Gold Fundamental Price is up 5 bucks to $1,312, notwithstanding that the market price is down this week. |
Gold Basis and Co-basis and the Dollar Price(see more posts on dollar price, gold basis, Gold co-basis, ) |
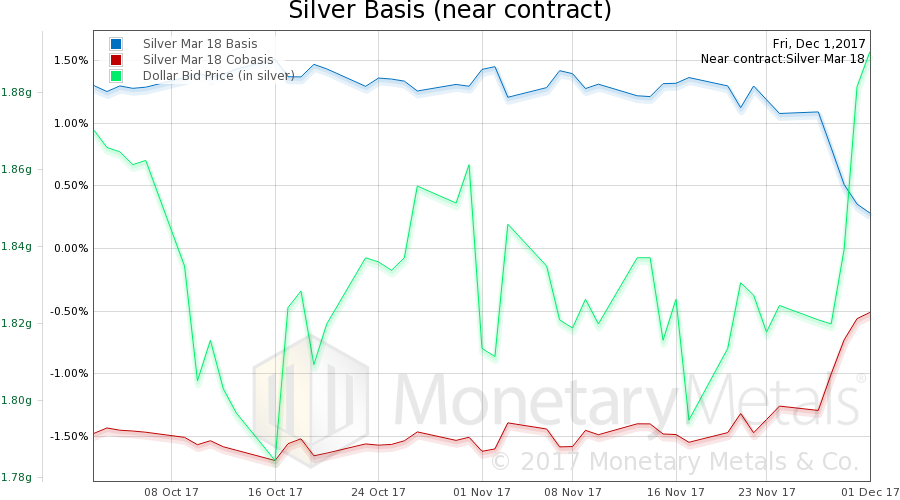
Silver Basis and Co-basis and the Dollar PriceNow let’s look at silver. In silver like in gold, we see the co-basis up sharply. However, unlike in gold, the price dropped quite a lot. And so we have a good news / bad news scenario. The good news is that the Monetary Metals Silver Fundamental Price is now about 50 cents over the market price. The bad news is that it is down 32 cents. If you trade the fundamental, this may be a good time to buy silver. Or if you are a contrarian. The price has been sold down a lot, to a level not seen since August. If you prefer to do technical analysis on the fundamentals (the fundamental price is not technical analysis in itself, notwithstanding some have claimed that), then you may see momentum developing to the downside and wish to wait for it to stabilize. All we can say is that, if you back out the actions of the speculators, supply and demand of physical metal meet around $16.92. The market price closed on Friday at $16.41. The fundamentals could weaken further. The market price could fall further without change in the fundamentals. It is not the purpose of this letter to say what traders ought to do. We can say that, in our fund (which trades the gold-silver ratio) we are long silver for the first time since the summer. |
Silver Basis and Co-basis and the Dollar Price(see more posts on dollar price, silver basis, Silver co-basis, ) |
© 2017 Monetary Metals
Charts by: Monetary Metals
Chart and image captions by PT
Full story here Are you the author? Previous post See more for Next postTags: Chart Update,dollar price,gold basis,Gold co-basis,gold price,gold silver ratio,newslettersent,Precious Metals,silver basis,Silver co-basis,silver price


