Jeffrey P. Snider
My articles My offerMy siteAbout meMy videosMy books
Follow on:LinkedINTwitterSeeking Alpha
| Federal Reserve revisions to the Consumer Credit series have created some discontinuities in the data. Changes were applied cumulatively to December 2015 alone, rather than revising downward the whole data series prior to that month. The Fed therefore estimates $3.531 trillion in outstanding consumer credit (seasonally-adjusted) in November 2015, and then just $3.417 trillion the following month.
Of that $114.3 billion revised away, the vast majority, $89.3 billion, came out of non-revolving credit balances. Revolving credit was reduced by a little over $25 billion. |
Consumer Credit Monthly Flow, Jan 2012 - Jul 2017 - Click to enlarge |
| Despite that discontinuity, revolving consumer credit growth remains elevated at least when compared to before March 2015. Post revisions, credit growth is obviously less than what the Fed calculated before them, but there remains a clear increase in revolving balances going back to when the “rising dollar” downturn turned more serious. |
Consumer Credit Monthly Flow, Jan 2010 - 2017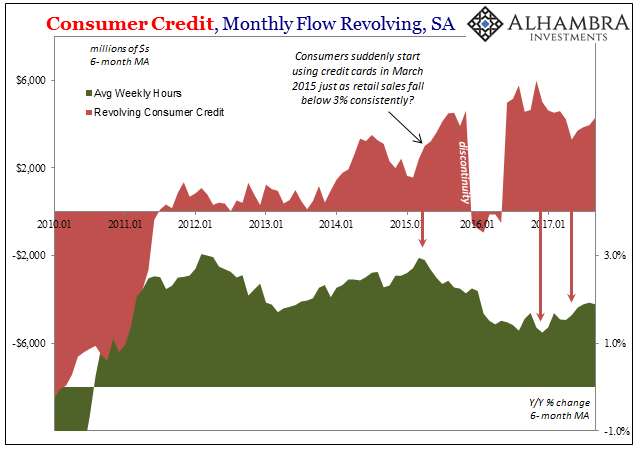 - Click to enlarge |
| That shift matches up very well with separate data provided by the BLS on the labor market slowing. It, too, began around the same time, a correlation that isn’t surprising given the continually weak state of workers and therefore consumers.
The inverse relationship has continued through the “reflation” earlier this year, where at least total hours picked up at the end of last year suggesting some relative, if ultimately minor, improvement in the labor market. At the same time, revolving credit usage dropped off to a noticeable degree. Going back to around May, however, revolving credit balances have been accelerating again just as the labor market improvement at least indicated by hours worked seems to have stalled. Correlation is not causation, but it’s a reasonable inference in this case given that recent history. |
Consumer Credit Monthly Flow, Jan 2010 - 2017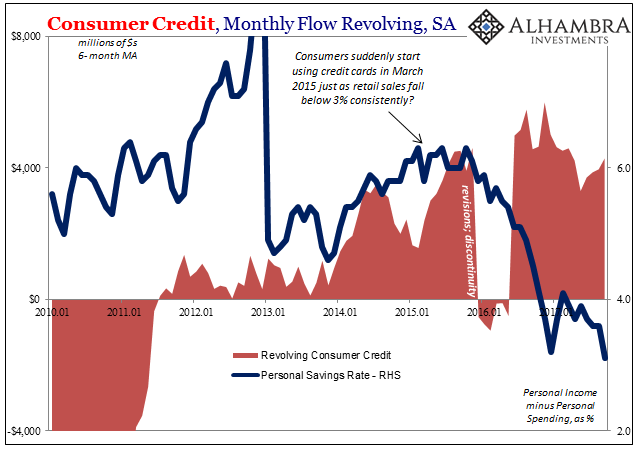 - Click to enlarge |
| Both of these data series further match up well with the Personal Savings Rate that beginning in 2016 fell sharply. The combination of a falling savings rate and rising revolving consumer credit would usually signal the start or deepening of economic recovery to its fullest potential, but in this case the opposite condition appears far more likely.
The series for non-revolving credit, which is slowing rather than rising, actually furthers that interpretation. Auto loans/leases in particular are tied to consumer caution (in a real sense quite apart from surveys of consumer confidence that don’t any longer correlate to actual consumer behavior) because of the required payment commitment, which would be the more consistent view of the Personal Savings Rate in light of behavior pertaining to revolving credit. |
Consumer Credit Monthly Flow, Jan 2010 - 2017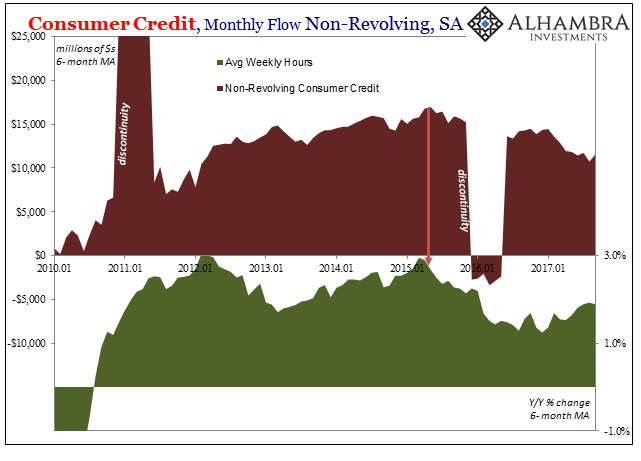 - Click to enlarge |
| After steadily accelerating at a reduced rate since 2012, monthly non-revolving flows peaked in May 2015. Since then, additional loan balances have pulled back at a monthly rate almost a third less; a significant deceleration coincident, of course, to the “plateau” in auto sales. |
US Retail Sales, Jun 2011 - Aug 2017(see more posts on U.S. Retail Sales, )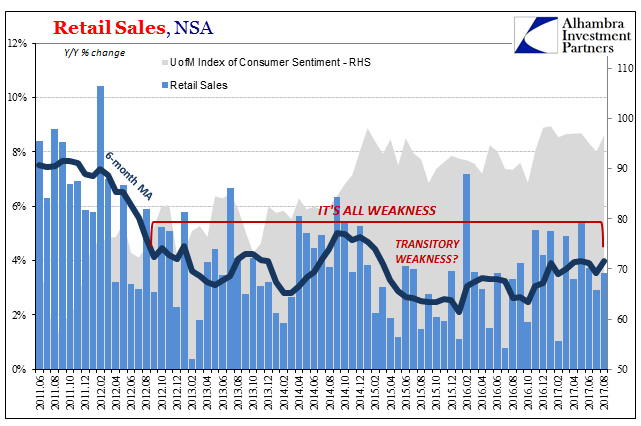 - Click to enlarge |
| The shift in revolving consumer credit isn’t anywhere near large enough to offset decelerating national income after the last downturn. It is instead as an alternate measure of consumer behavior, offering perhaps a more realistic look at the state of consumers that isn’t being captured by those sentiment surveys. That’s, again, also the case with non-revolving spending going in the other direction. |
University of Michigan Consumer Confidence, Jan 1997 - 2017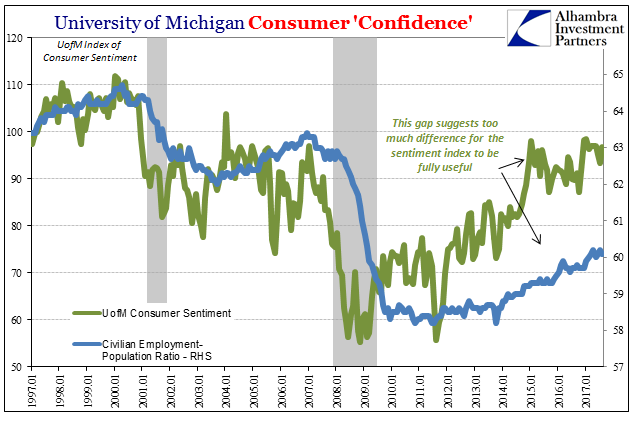 - Click to enlarge |
What’s relevant about both is that those trends, altered slightly along the way (revolving), are still in place this far into 2017. The underlying economic fundamentals in the consumer/worker space have not really changed for the last two years despite every reason otherwise that they should have. This is not at all what we would expect to find at full employment.
For the Federal Reserve, the government agency responsible for the data, it’s more troubling news as it searches desperately for inflationary conditions especially via wage growth and a “tight” labor market, neither of which are evident.
Full story here Are you the author?Tags: Consumer Confidence,Consumer Credit,consumer spending,credit cards,currencies,economy,Federal Reserve/Monetary Policy,Labor Market,Markets,newslettersent,revolving credit,U.S. Retail Sales