Marc Chandler
My articles My offerMy siteAbout meMy videosMy books
Follow on:LinkedINTwitterSeeking AlphaAmazon
George Dorgan
My articles My siteAbout meMy videosMy books
Follow on:LinkedINTwitterSeeking Alpha
CFA SocietyEconomicBlogs
Summary:
Euro is testing trendline and retracement objective and 100-day moving average.
Technical indicators on daily bar charts warn of upside risk.
Two-year rate differentials make it expensive to be long euros vs. US.
Beware of small samples that may exaggerate seasonality.
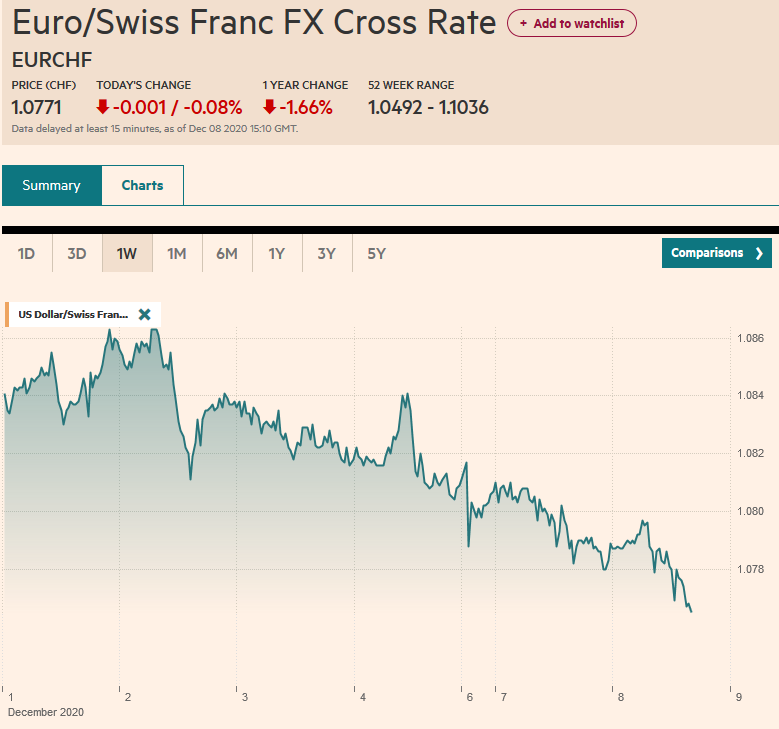
| This Great Graphic, created on Bloomberg, shows that the euro is approaching key area.
The white trendline drawn off the September 8, September 20 and October 26 highs comes in near $1.1745 today. Above there, the lower green horizontal line is the 38.2% retracement of the drop since the years high was recorded on September 8. It is found at $1.1760. The euro has been bid through the 20-day moving average (green line) for the first time since the ECB meeting in late October. The five-day moving average (fuchsia line) is poised to cross above the 20-day average for the first time since before the ECB meeting. The 100-day moving average, which is not shown in the chart, comes in today a little above $1.1730. The euro fell below it with the ECB-inspired sell-off at the end of last month for the first time since April. It checked the euro earlier this month. A move above this general area would target the $1.1825-$1.1885 area. The technical indicators on the daily charts warn of this upside risk. |
EUR/BGN Currency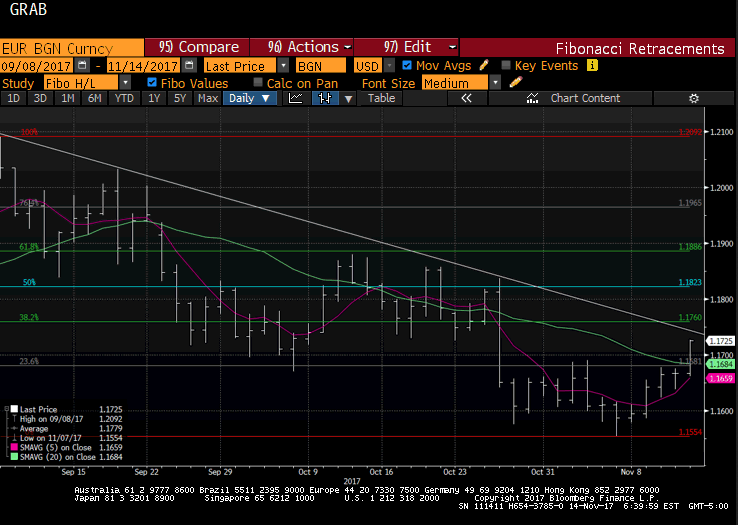 - Click to enlarge |
There is much talk about a seasonal pattern for euro weakness in Q4, but we are skeptical. The euro did fall in October this year and the past three years. It also fell on November 2014-2016. In December, the euro has fallen in two of the past three years. If one flipped a coin six times and four times it came up heads, one would not think the contest is rigged, but some market participant sees a seasonal pattern here. We argue that the sample size is too small and when it is enlarged to cover the past 20 years, no such seasonality is evident. Over the past 20 years, the euro has risen in exactly 10 of the Octobers. It has risen in nine of the past 20 Novembers and Decembers. If there is a pattern it might be that the euro’s performance in Q4 is consistent with its underlying trend. Recall that the euro put in the recent peak in 2014, when the seasonal pattern is said to have begun.
Technical indicators of the daily bar charts suggest upside room, while the two-year interest rate differential makes it the most expensive to hold long euros against the dollar since the last 1990s. We continue to argue that divergence of monetary policy (rates and balance sheet) is still more than a year away from peaking. We are inclined to view the euro gains as corrective after retreating for the past two months.
Full story here Are you the author?Tags: $EUR,Great Graphic,newslettersent