


Keith Weiner
My articles My offerMy siteAbout meMy videosMy books
Follow on:LinkedINTwitterSeeking AlphaFacebookAmazonGoogle +
See the introduction and the video for the terms gold basis, co-basis, backwardation and contango.
Chart PatternsThe prices of the metals dropped $20 and $0.39, a downhill slide interrupted on Thursday by speculation fueled by some economic data (as we covered in our special report), and which resumed on Friday. A look at the price charts of both metal shows what could be head and shoulders patterns. The left shoulders are in June. The head is in September. And the right shoulder is occurring now. Or if you zoom out and look back to the start of 2017, you see a series of higher highs. In gold, at least. In silver, if you zoom to look at a graph starting in mid-2016, you see a series of lower highs. Trying to divine the next price move based on past price action is trying to act based on incomplete information: the fundamentals. In stocks, we don’t know many people who look only at price charts, without regard to the company behind the stock. Why should it be any different in gold and silver? |
Gold Daily(see more posts on Gold, )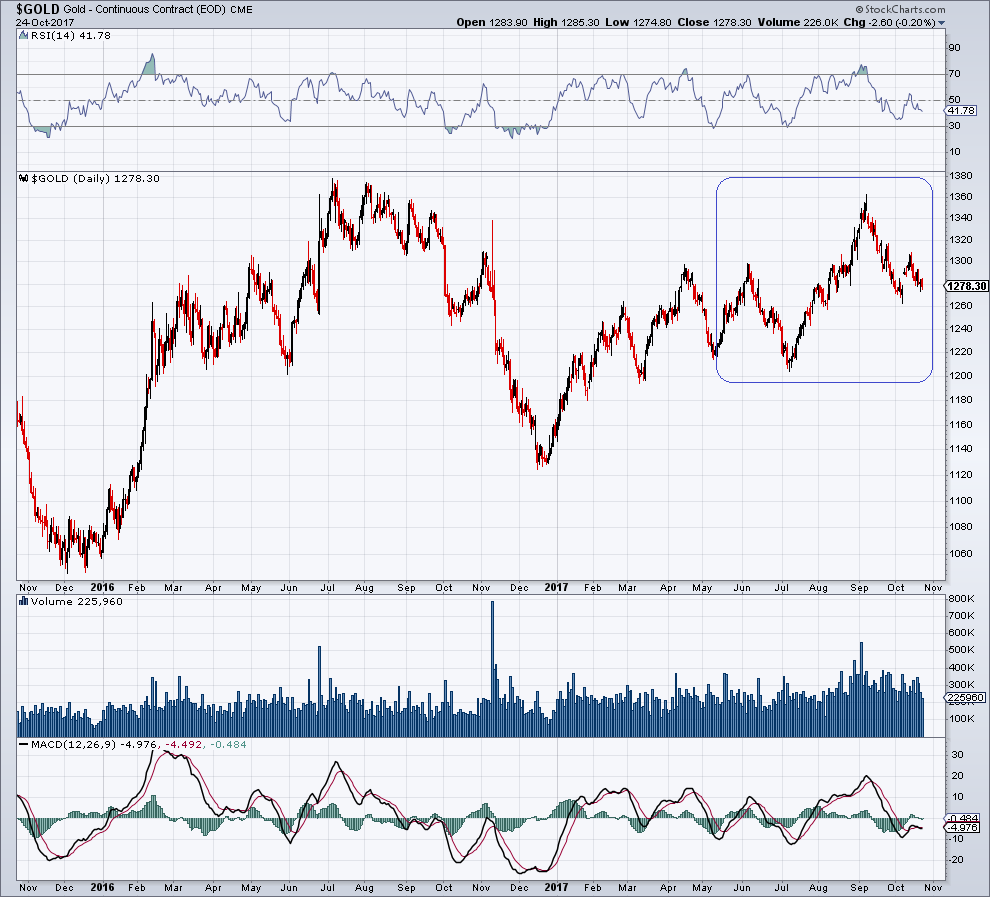 Gold over the past two years. The blue rectangle outlines the pattern discussed below. - Click to enlarge It doesn’t really work well as a head and shoulders (H&S) pattern in gold, since the neckline would be beyond skewed. We should also mention that this pattern is really not what seems to be commonly believed nowadays. In its original meaning, an H&S pattern can only occur at the end of an extended trend, with the “head” marking a major price peak. The recent “head” would be below the peak seen last year, so it is disqualified based on this definition. Similarly, an inverse H&S pattern occurs only at a major low, not somewhere in the middle of a trend. Gold has moved sidewaysin a series of overlapping waves since rallying from late 2015 to mid-2016. In other words, this some sort of (complex) corrective formation is being built. Given that it has been two years since the price low (in non-dollar currencies the low was made 3 to 5 years ago), it seems highly unlikely that this is a corrective wave in a primary bear market. It is not impossible, but it isn’t likely. In USD terms gold trades 23% above its 2015 low – and it does so despite a fundamental macro backdrop that is at best neutral with a bearish tilt. All of this points to a beginning cyclical bull market. |
Fundamental DevelopmentsWe will look at an updated picture of supply and demand. But first, here are the charts of the prices of gold and silver, and the gold-silver ratio. |
Gold and Silver Prices(see more posts on gold price, silver price, )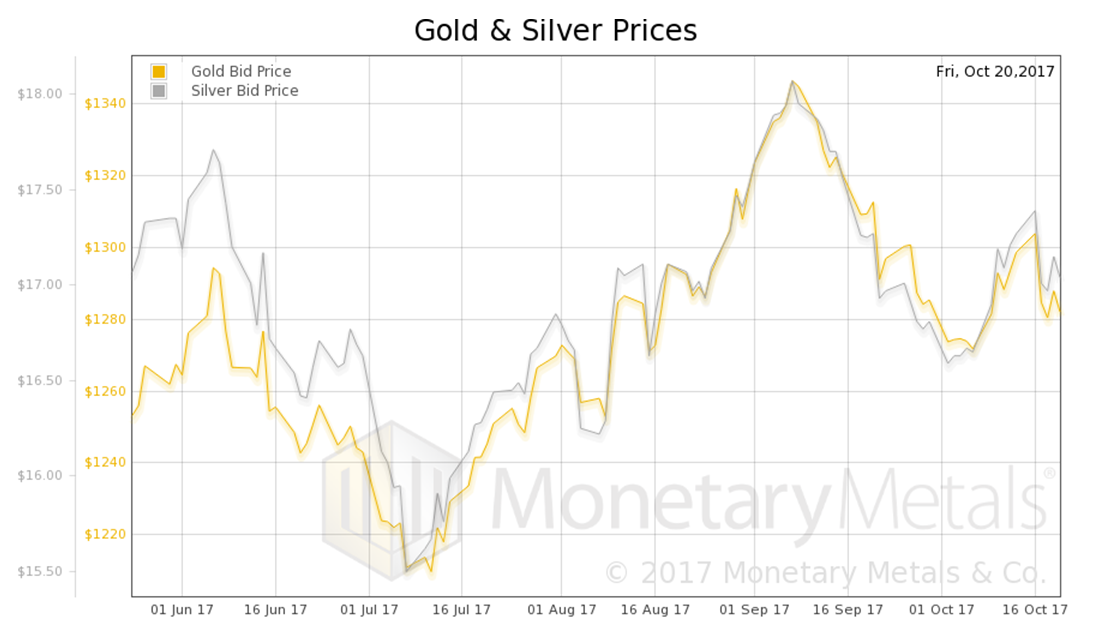 Gold and silver priced in USD - Click to enlarge |
Gold:Silver RatioNext, this is a graph of the gold price measured in silver, otherwise known as the gold to silver ratio. The ratio rose a bit.
|
Gold:Silver Ratio(see more posts on gold silver ratio, )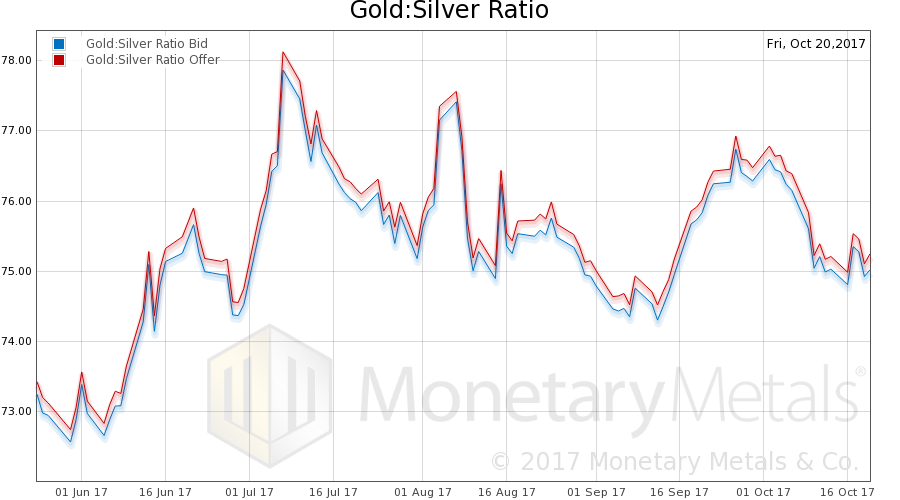 Gold-silver ratio, bid and offer - Click to enlarge |
Gold Basis and Co-basis and the Dollar PriceHere is the chart of the price of the dollar (inverse of the price of gold, in dollars) overlaid with basis and co-basis. The dollar is up (i.e. price of gold is down). And the gold basis (i.e. abundance) is down, and co-basis (i.e. scarcity) is up. Our calculated Monetary Metals gold fundamental price rose $17. |
Gold Basis and Co-basis and the Dollar Price(see more posts on dollar price, gold basis, Gold co-basis, )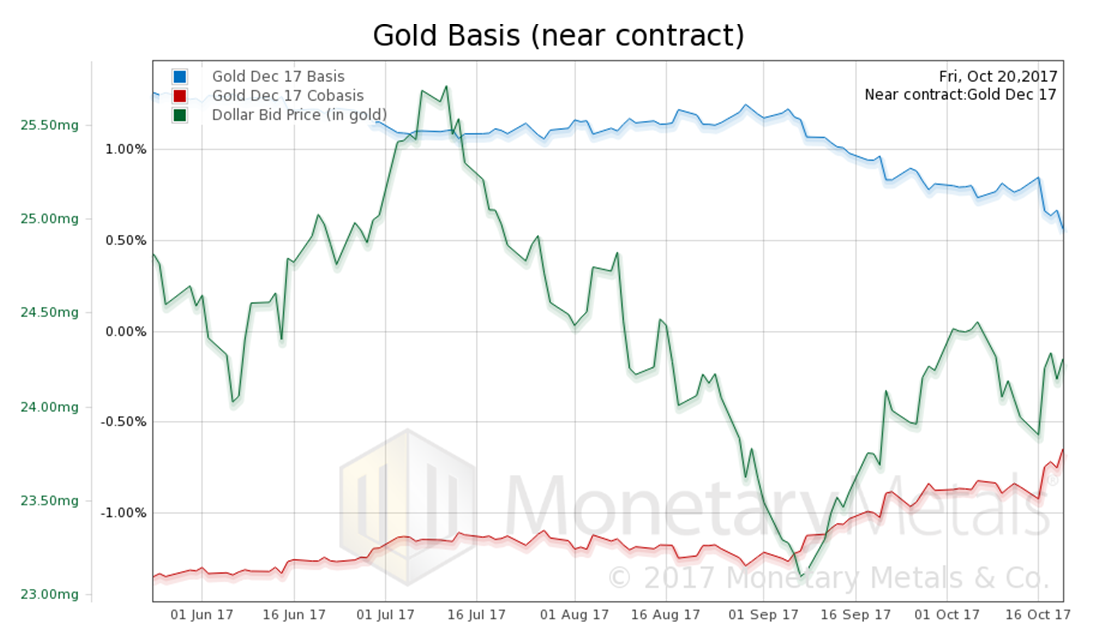 Gold basis and co-basis and the USD priced in milligrams of gold - Click to enlarge |
Silver Basis and Co-basis and the Dollar PriceNow let’s look at silver. Unlike in gold, in silver the basis and co-basis did not move (in particular the continuous silver basis). However, the price did fall and greater than gold in proportion. Our calculated Monetary Metals silver fundamental price fell $0.22, to $17.08. What do you get if you combine this with the silver price chart showing lower highs? A price target for the bottom of the trend perhaps in the mid 15’s, and a gold-silver ratio well over 80. |
Silver Basis and Co-basis and the Dollar Price(see more posts on dollar price, silver basis, Silver co-basis, )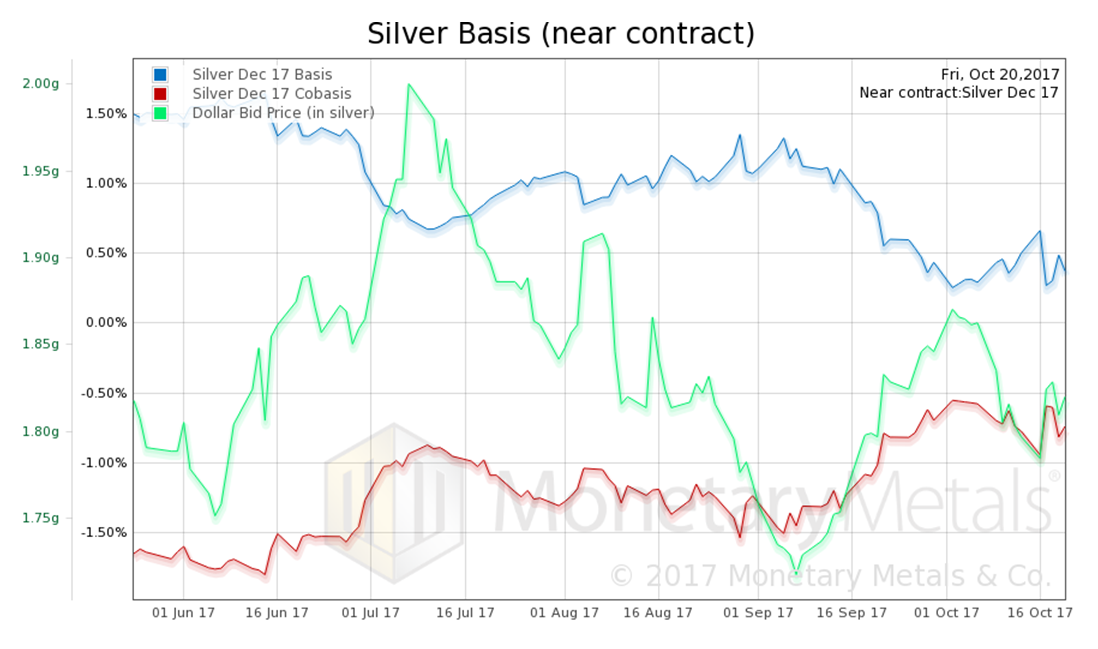 Silver basis and co-basis and the USD priced in grams of silver - Click to enlarge |
Full story here Are you the author?
Tags: dollar price,Gold,gold basis,Gold co-basis,gold price,gold silver ratio,newslettersent,Precious Metals,silver basis,Silver co-basis,silver price


