Keith Weiner
My articles My offerMy siteAbout meMy videosMy books
Follow on:LinkedINTwitterSeeking AlphaFacebookAmazonGoogle +
See the introduction and the video for the terms gold basis, co-basis, backwardation and contango.
Fundamental DevelopmentsThe prices of the metals shot up last week, by $28 and $0.57. |
 Heavy metals became pricier last week, but we should point out that the stocks of gold and silver miners barely responded to this rally in the metals, which very often (not always, but a very large percentage of the time) is a sign that the rally is unlikely to continue or hold in the short term. - Click to enlarge |
| Last week, we said:
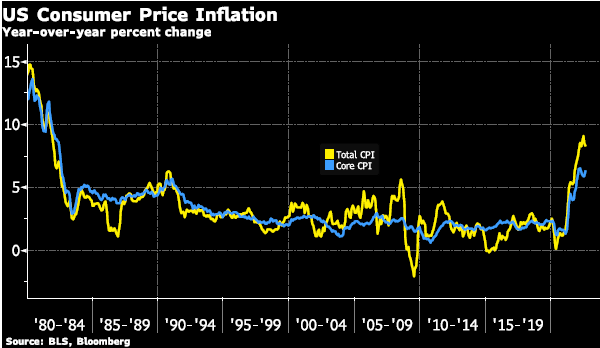
That described this week perfectly, especially Friday morning. The Consumer Price Index came in below the Fed’s target. It was up 1.7%, below the 1.8% expected and 2% Fed policy target. This news ignited a 20-cent increase in the price of silver within minutes. We have to take a moment to savor the irony. Suppose the economy is underperforming Fed targets. And therefore the Fed will do more of what it had been doing, during which time the prices of gold and silver had been falling. But this time — so the theory goes — the increase in the quantity of dollars will cause the prices of the metals to go up. |
Eurozone Consumer Price Index(see more posts on Eurozone Consumer Price Index, )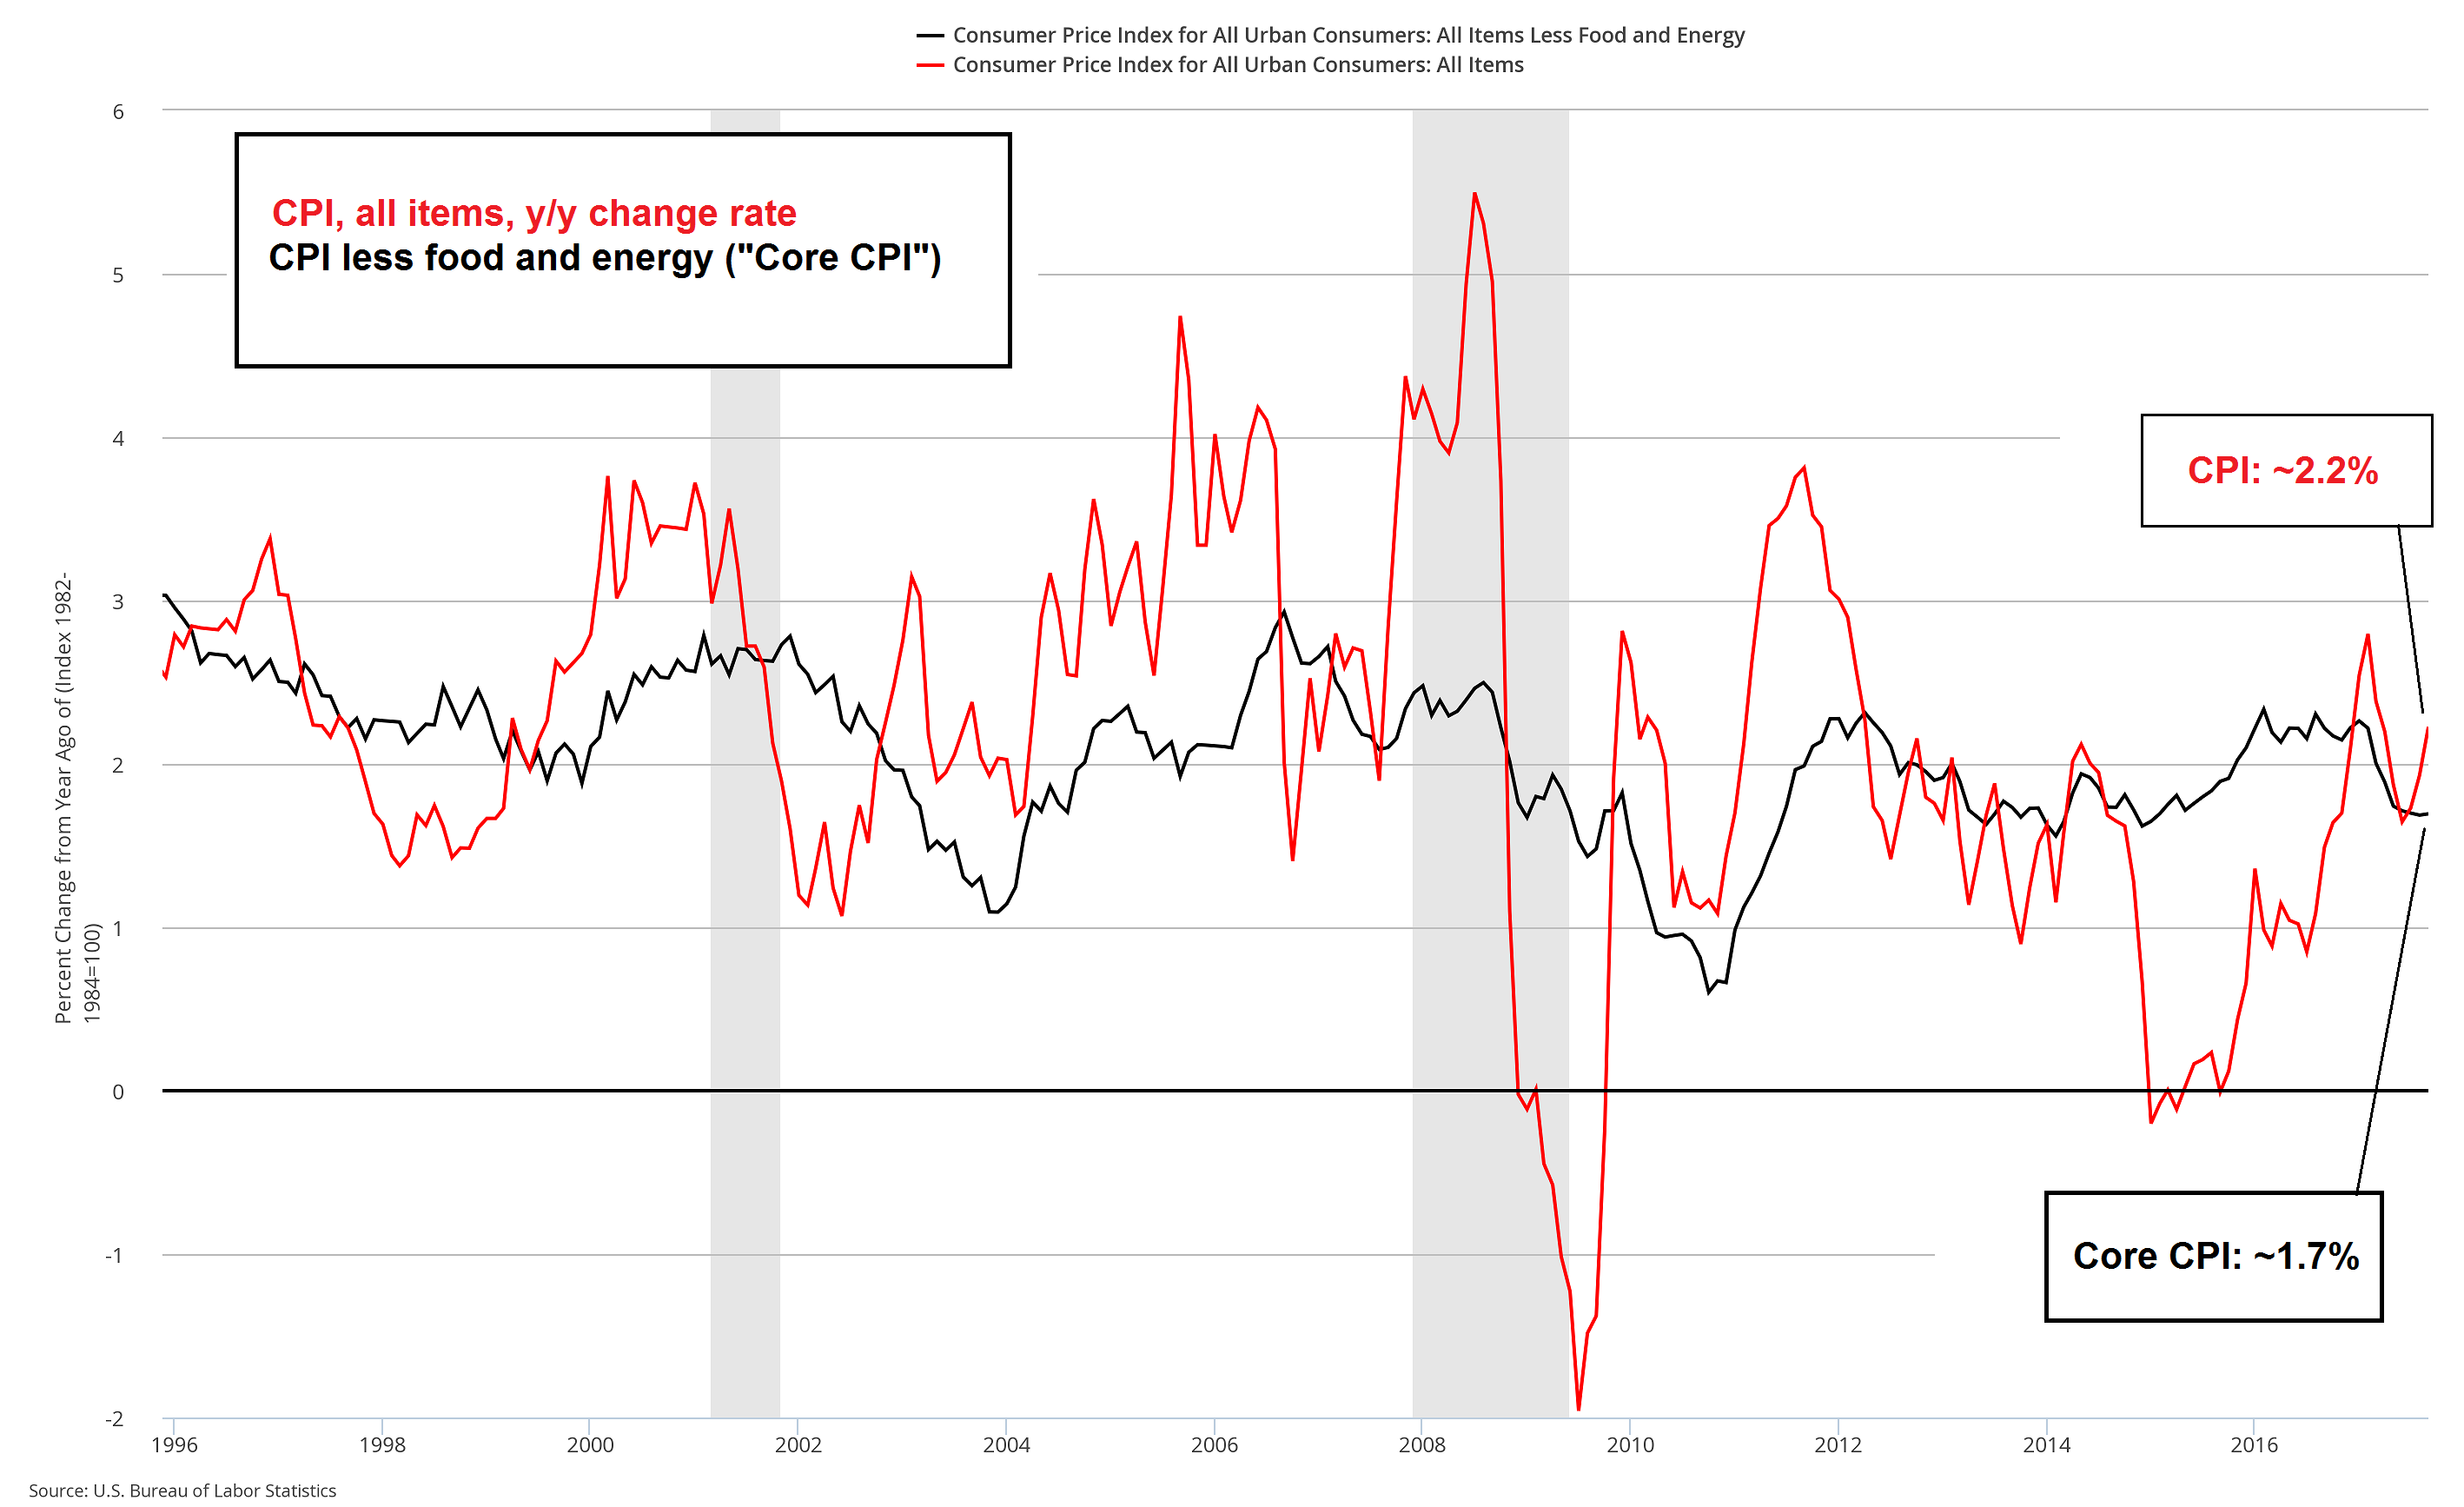 Actually, headline CPI is already above the Fed’s target, as its rate of change amounted to 2.2% y/y. However, so-called “core” CPI (excludes food and energy prices on account of their volatility) came in at slightly less than 1.7% y/y, which the markets evidently considered a “miss” in terms of achieving the Fed’s stated target rate (an utterly bizarre and quite frankly outright dangerous aim to pursue). - Click to enlarge A brief comment on Keith’s remarks below: it is true that these month-to-month data releases are essentially meaningless. However, the increase in the money supply over time does lead to a rise in prices across the economy roughly to the extent to which it exceeds the growth in the production of goods and services. But it does so in an uneven manner – not all prices increase at the same time or to the same extent – some of them will even fall (the so-called “general price level” is a mirage – in fact, it cannot be calculated, as there exists no fixed yardstick with which to “measure it”, even if one is prepared to ignore the logical fallacy of adding up the prices of disparate goods and averaging the result). Moreover, in the short to medium term an increase in the demand for money (cash balances) can overcome the effects of a surging money supply. In a well-developed economy, the demand for money usually only rises significantly during times of crisis (modern payment systems have generally lowered the need to hold large cash balances or large amounts of standard money). Over the long term, prices will tend to “catch up” with the increase in the quantity of money. As a reminder, when gold first began to trade freely, it could be bought for a little over $35 per ounce. In the 46 years since then, the broad true money supply has grown from approx. $500 billion to $12.7 trillion and prices in the economy have increased accordingly; whether one looks at the gold price or a McDonalds menu, the difference is palpable, and the money supply is the culprit. It should be obvious that if the money supply had e.g. remained unchanged, prices could not possibly be where they in fact are today – the purchasing power of money would have increased rather than decreased over time, due to growth in economic productivity. |
| In our view, the trend will continue: falling interest, rising debt, falling marginal productivity of debt… and the prices of the metals will one day skyrocket for some reason. But today is not that day, and Fed policy to increase quantity of dollars is not that reason.
In our view, these data releases are not important, just noise. We will look at an updated picture of the fundamentals of supply and demand of both metals. But first, here are the charts of the prices of gold and silver, and the gold-silver ratio. |
Gold and Silver prices(see more posts on gold price, silver price, )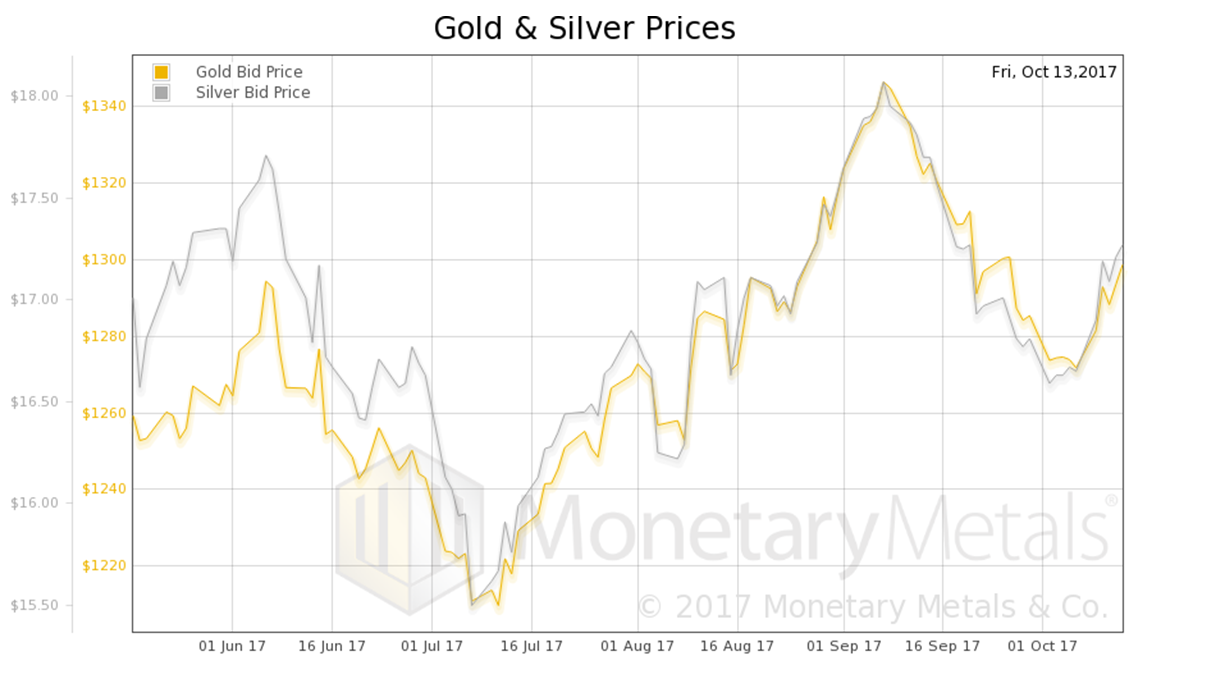 Gold and silver priced in USD - Click to enlarge |
| Next, this is a graph of the gold price measured in silver, otherwise known as the gold to silver ratio. The ratio fell.
|
Gold:Silver Ratio(see more posts on gold silver ratio, )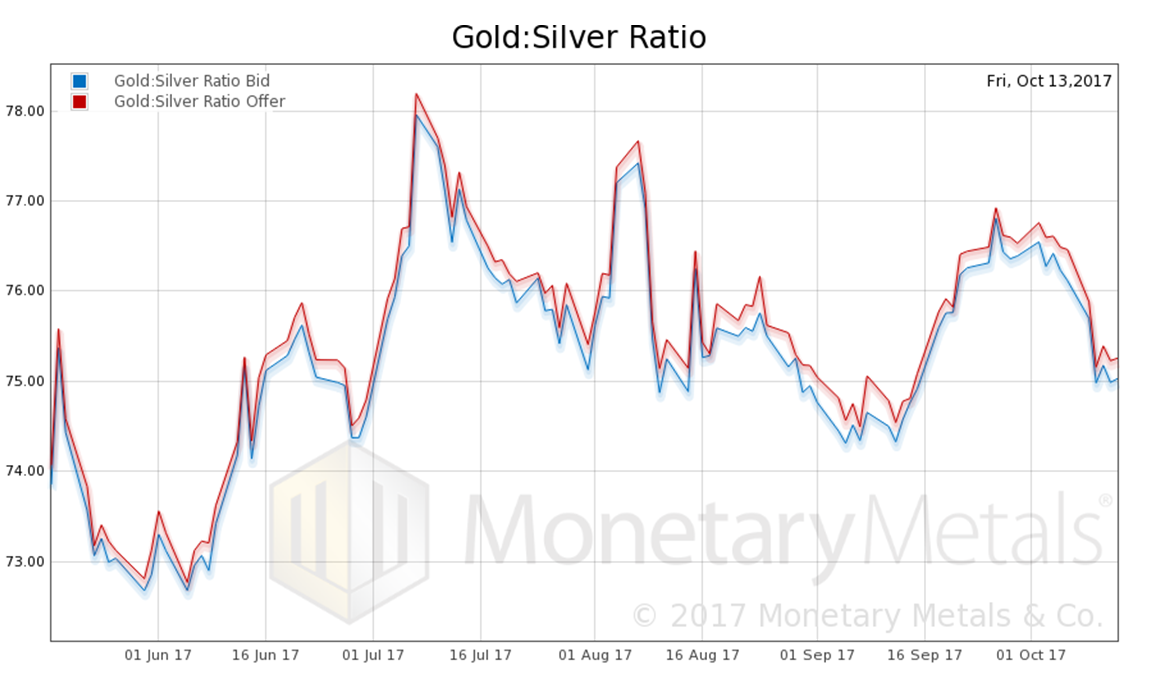 Gold-silver ratio, bid and offer - Click to enlarge |
Here is the graph showing the gold basis and co-basis overlaid with the price of the dollar (inverse to the price of gold, measured in dollars). |
Gold Basis and Co-basis and the Dollar Price(see more posts on dollar price, gold basis, Gold co-basis, )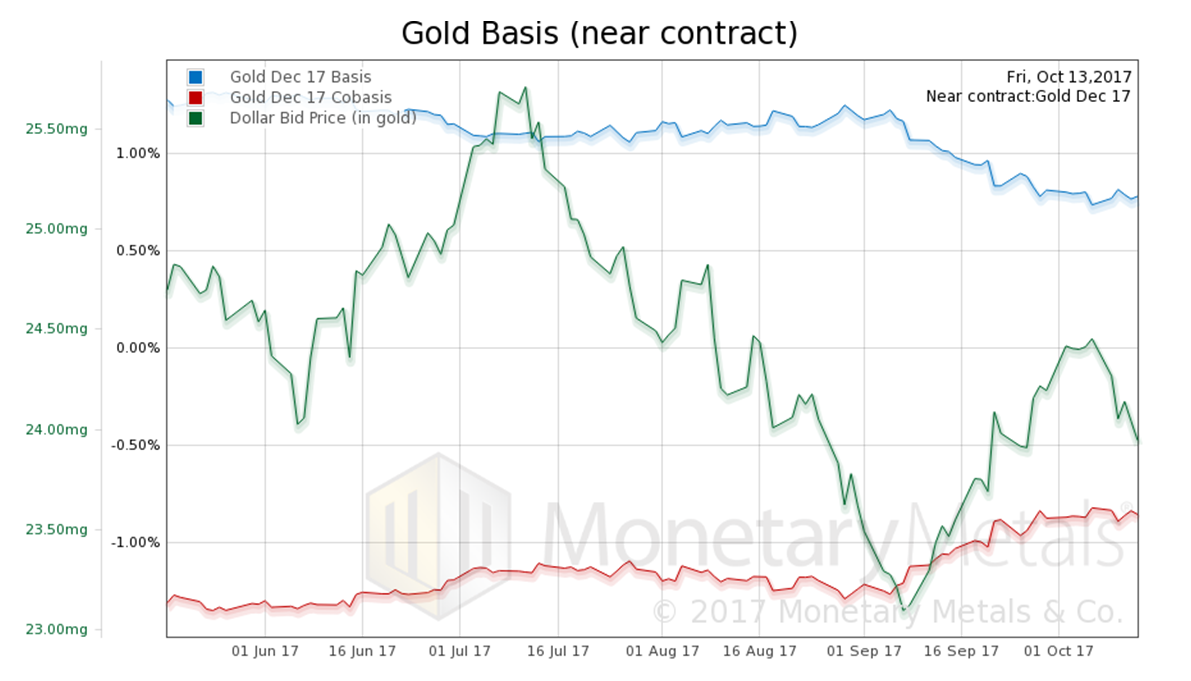 Gold basis and co-basis and the USD priced in milligrams of gold - Click to enlarge |
| The basis (i.e., abundance) is up and co-basis (i.e., scarcity) is down a bit. Which is what you’d expect if speculators pushed up the price of futures with leveraged bets. The price of spot is pulled up by the arbitragers, but trails the price of futures.
Our calculated Monetary Metals gold fundamental price was up, but not as much as the market price. Six bucks. Now let’s look at silver. |
Silver Basis and Co-basis and the Dollar Price(see more posts on dollar price, silver basis, Silver co-basis, ) Silver basis and co-basis and the USD priced in grams of silver. - Click to enlarge |
The same pattern occurs in silver. The metal is more abundant at the higher price.
Our calculated Monetary Metals silver fundamental price was also up last week, by 32 cents.
Full story here Are you the author?Tags: dollar price,Eurozone Consumer Price Index,gold basis,Gold co-basis,gold price,gold silver ratio,newslettersent,Precious Metals,silver basis,Silver co-basis,silver price