


Keith Weiner
My articles My offerMy siteAbout meMy videosMy books
Follow on:LinkedINTwitterSeeking AlphaFacebookAmazonGoogle +
See the introduction and the video for the terms gold basis, co-basis, backwardation and contango.
Fat-Boy WavesThe prices of the metals dropped $17 and $0.35, and the gold-silver ratio rose to 77. A look at the chart of either metal shows that a downtrend in prices (i.e. uptrend in the dollar) that began in mid-April reversed in mid-July. Then the prices began rising (i.e. dollar began falling). But that move ended September 8. |
Gold Daily(see more posts on Gold, )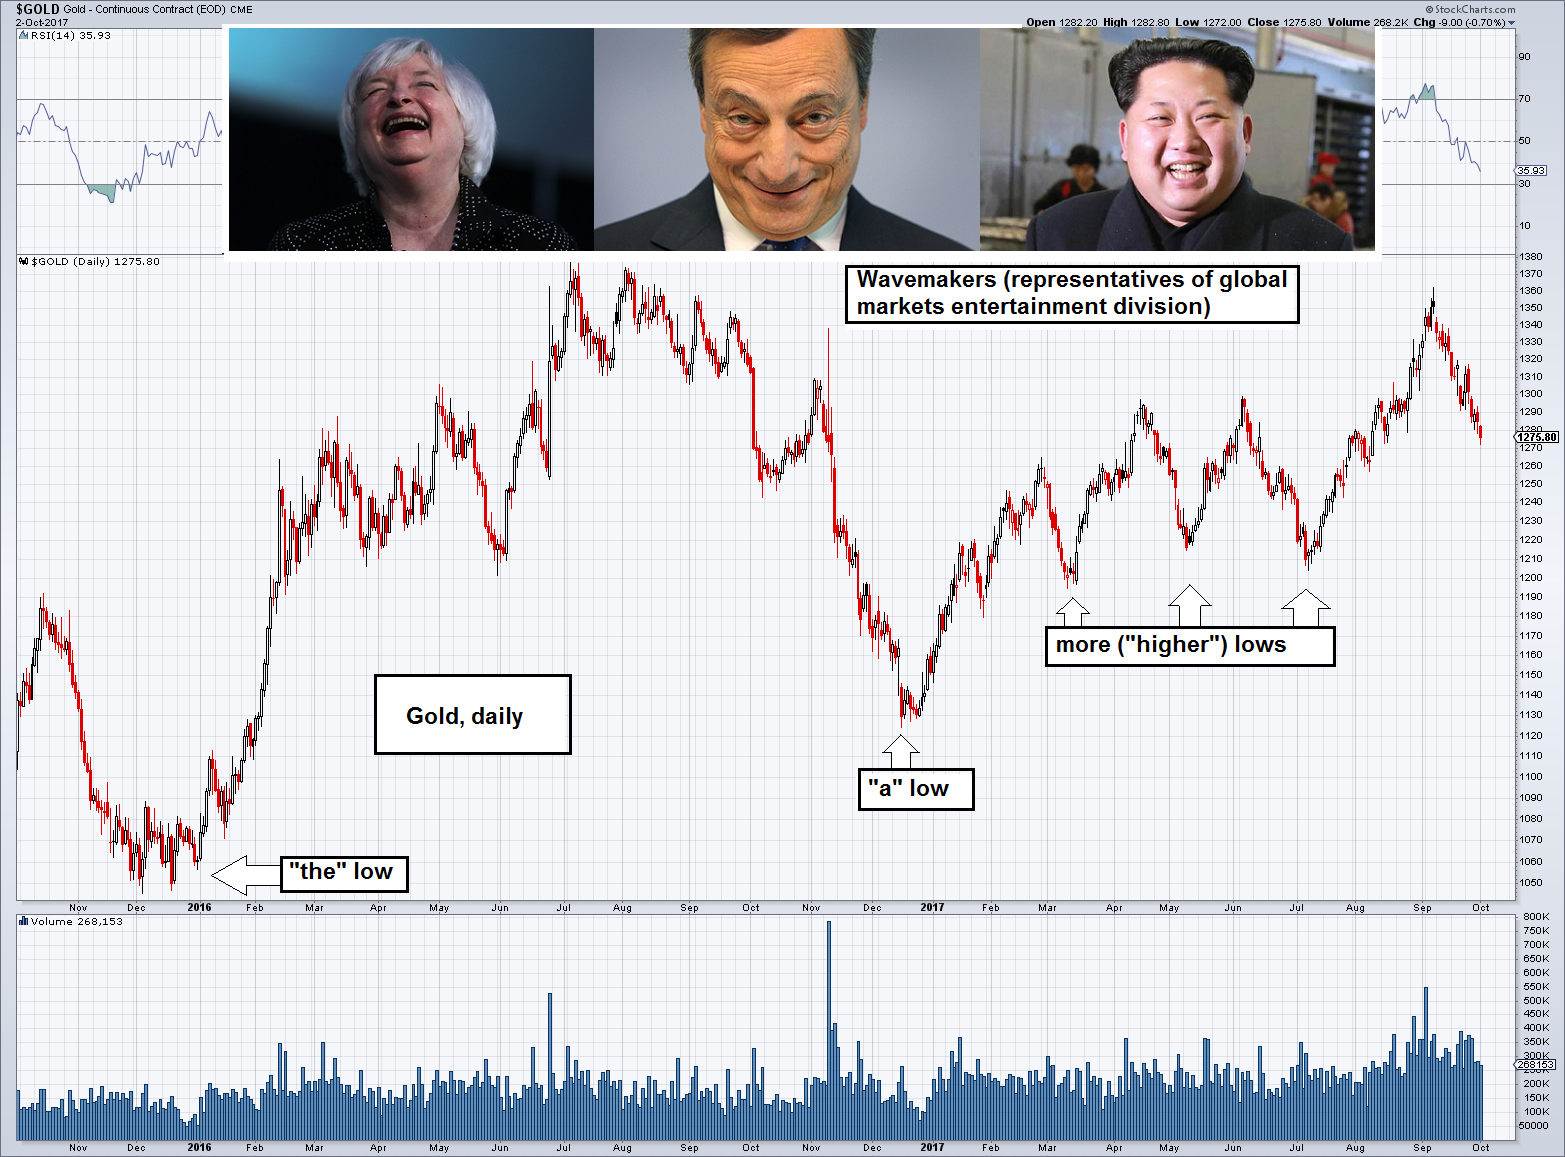 Stars of the most popular global market sitcoms, widely suspected of being “gold wave-makers”. - Click to enlarge From left to right: Auntie Janet “Transitory” Yellen, Mario “Smaug” Draghi, and last but not least, the healthiest leader in history, Jong-un “Fat-Boy” Kim, as always positively radiating good vibes. |
| One way to think of these moves is as the addition of energy into the market. Like tossing a pebble into a still pond (not quantity of water, but energy that perturbs it). Once the speculators get the idea that gold and especially silver should go up, well it becomes self-fulfilling. Statements by the Fed, the ECB, or even the fat-boy who rules North Korea can all have an effect.
Buying begets buying, as the chart shows signs of a breakout. But then, especially in this moribund market, the energy of new speculation is depleted. And the price subsides, until new energy is added by the next event. We are in that mode right now. |
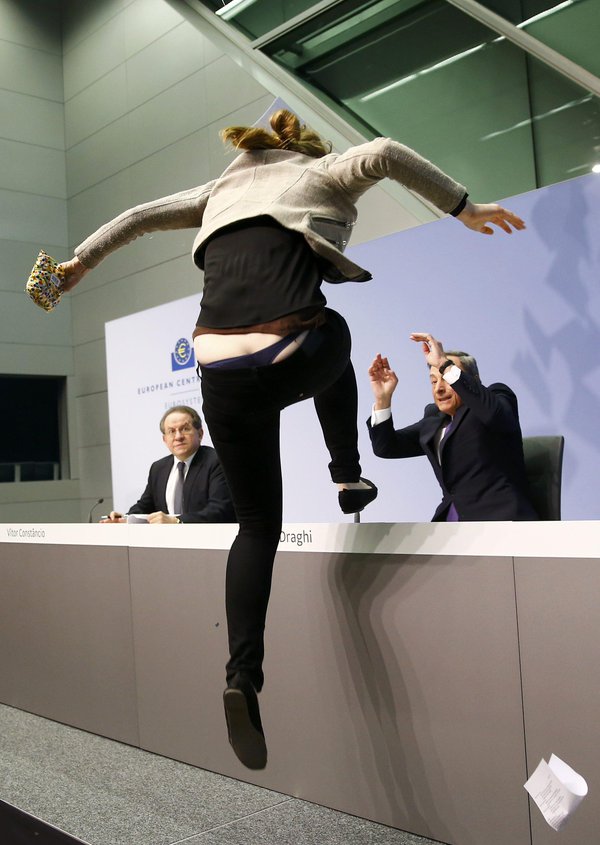 Photo credit: Reuters - Click to enlarge A scene from the famed European hit sitcom “Not Enough Inflation”, season 15, episode 4: “Mario’s Nightmare”. |
Fundamental DevelopmentsWe will look at an updated picture of the fundamentals of supply and demand of both metals. But first, here are the charts of the prices of gold and silver, and the gold-silver ratio. |
Gold and Silver Prices(see more posts on Gold prices, silver price, ) Gold and silver, priced in USD - Click to enlarge |
Gold:Silver RatioNext, this is a graph of the gold price measured in silver, otherwise known as the gold to silver ratio. The ratio rose.
|
Gold:Silver Ratio(see more posts on gold silver ratio, )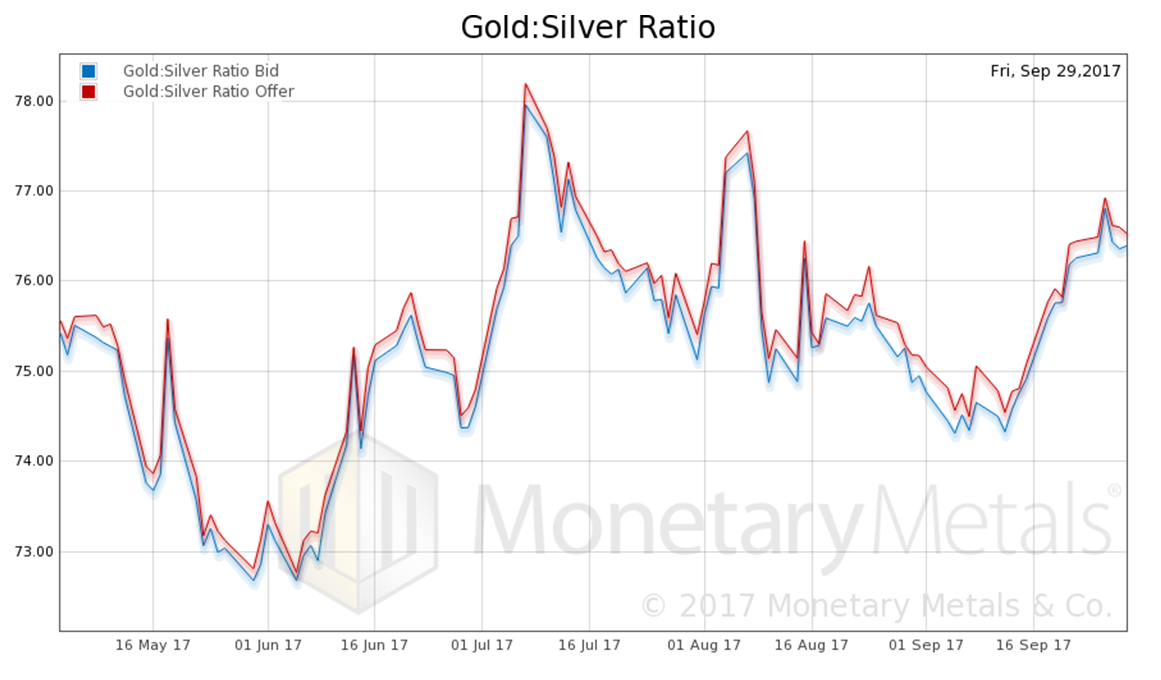 Gold-silver ratio, bid and offer - Click to enlarge |
Gold Price in USD
Below is the intraday gold graph showing Friday’s action, i.e., the gold price and the gold basis intraday (here you can see the regular 3-month gold basis chart). |
Gold Price in USD(see more posts on Gold prices, )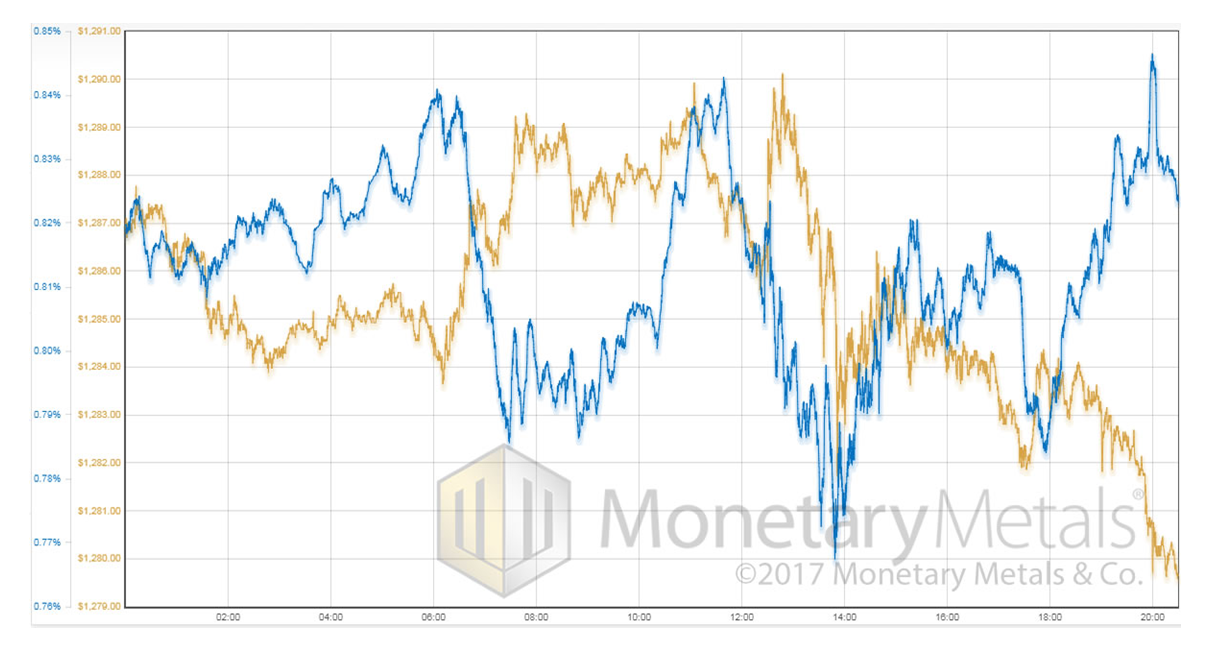 The gold price in USD (golden line) and the gold basis (blue line) - Click to enlarge |
Silver Price in USDThis is interesting. From a bit after 6am (GMT) the price of gold is rising but the basis is falling. That means the buying was fundamental, i.e., gold metal was bought. This lasted until a bit after 7am. At around 10:30am, something different occurred. Speculators started buying futures. They drove the price up from $1,288 to $1,290, but this took the basis up from 0.8% to 0.83%. After that, the basis tracked the price. That is, when price was falling basis was falling (i.e., futures were being sold) and when price was rising basis rose with it (i.e., futures were bought). By the way, don’t pay too much attention to the end of the day, as particularly on a Friday liquidity tends to dry up and the signal can be spurious. Our calculated Monetary Metals gold fundamental price fell $30 to $1,348. Now let’s look at the action in silver intraday on Friday (here is the regular daily silver basis chart). |
Silver Price in USD(see more posts on silver prices, )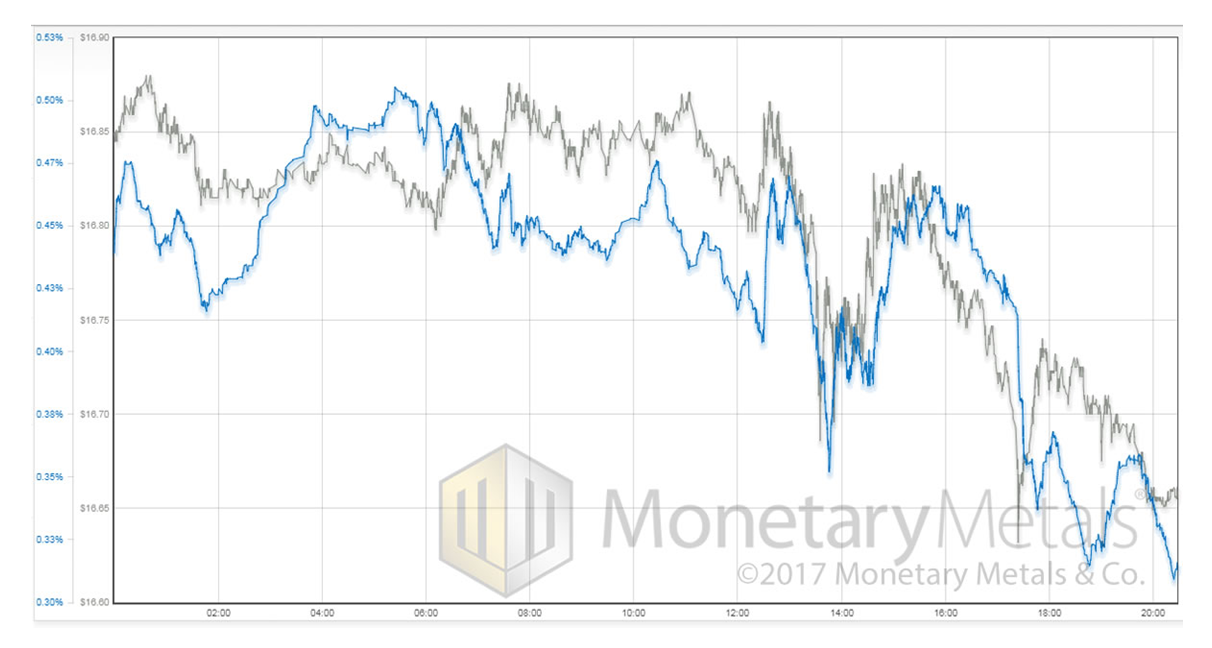 Silver priced in USD (gray line) and the silver basis (blue line) - Click to enlarge |
Interestingly again, we see the same fundamental buying of silver after 6am from $16.80 to $16.86 while the basis drops from 0.5% to 0.47%. After that, like in gold, the price action was driven by speculators in the futures markets.
Full story here Are you the author?Tags: Gold,Gold prices,gold silver ratio,newslettersent,Precious Metals,silver price,silver prices


