George Dorgan
My articles My siteAbout meMy videosMy books
Follow on:LinkedINTwitterSeeking Alpha
CFA SocietyEconomicBlogs
We do not like Purchasing Power or Real Effective Exchange Rate (REER) as measurement for currencies. For us, the trade balance decides if a currency is overvalued. Only the trade balance can express productivity gains, while the REER assumes constant productivity in comparison to trade partners.
Who has read Michael Pettis, knows that a rising trade surplus may also be caused by a higher savings rate while the trade partners decided to spend more. This is partially true.
Recently Europeans started to increase their savings rate, while Americans reduced it. This has led to a rising trade and current surplus for the Europeans.
But also to a massive Swiss trade surplus with the United States, that lifted Switzerland on the U.S. currency manipulation watch list.
To control the trade balance against this “savings effect”, economists may look at imports. When imports are rising at the same pace as GDP or consumption, then there is no such “savings effect”.
After the record trade surpluses, the Swiss economy may have turned around: consumption and imports are finally rising more than in 2015 and early 2016. In March the trade surplus got bigger again, still shy of the records in 2016.
Swiss National Bank wants to keep non-profitable sectors alive
Swiss exports are moving more and more toward higher value sectors: away from watches, jewelry and manufacturing towards chemicals and pharmaceuticals. With currency interventions, the SNB is trying to keep sectors alive, that would not survive without interventions.
At the same time, importers keep the currency gains of imported goods and return little to the consumer. This tendency is accentuated by the SNB, that makes the franc weaker.
Texts and Charts from the Swiss customs data release (translated from French).
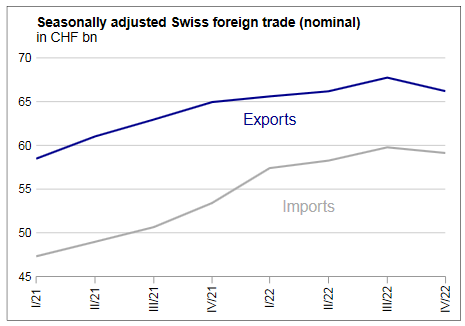
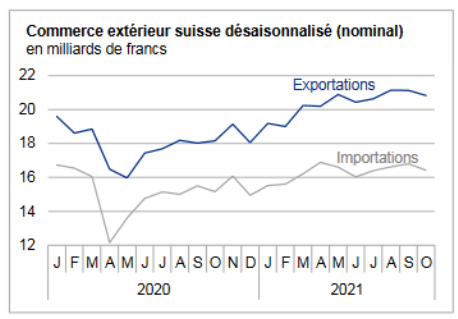
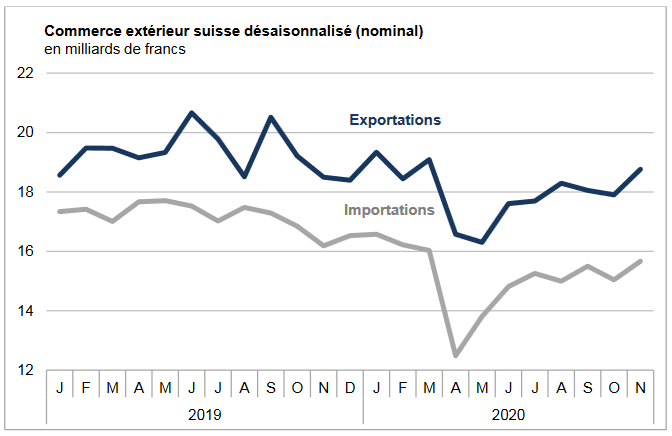
Exports and Imports YoY DevelopmentWith adjusted working days, exports grew by 2.5% and imports by 7.4% in the third quarter of 2017. Trade was thus consolidated at a high level. The balance of the trade balance contracted from 10.3 to 8.5 billion francs. In short |
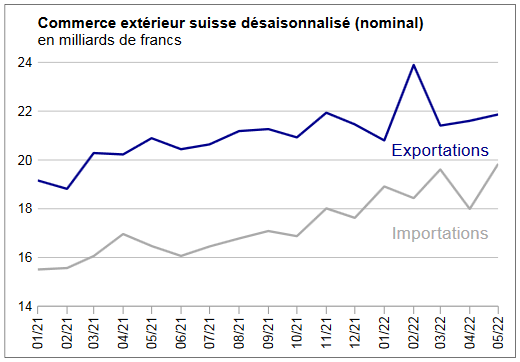
Swiss exports and imports, seasonally adjusted (in bn CHF), Q3 2017(see more posts on Switzerland Exports, Switzerland Imports, )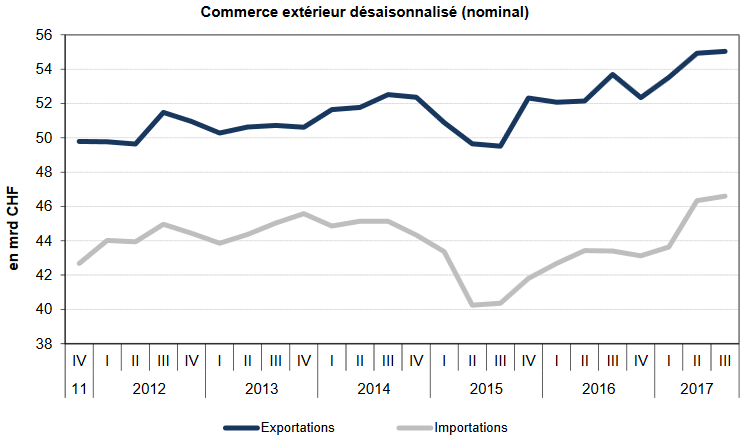 Source: Swiss Customs - Click to enlarge |
Overall EvolutionExports for the 3rd quarter of 2017 – adjusted for working days – increased by 2.5% over one year (actual: + 1.4%). After the previous record quarter (seasonally adjusted), they improved again by 0.2%. Imports increased by 7.4% year on year (real: + 1.6%). Compared to the second quarter of 2017, they still posted a seasonally adjusted 0.6% growth. In both directions of traffic, the positive trend has continued, albeit at a slower pace. |
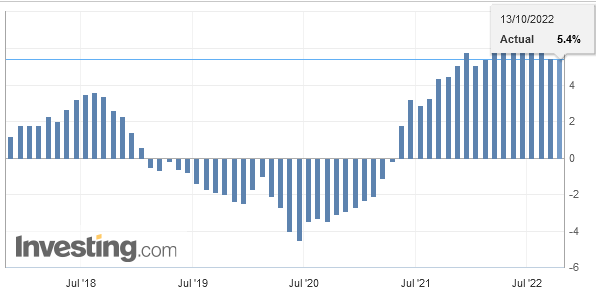
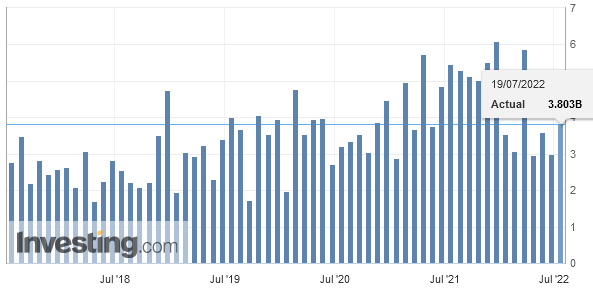
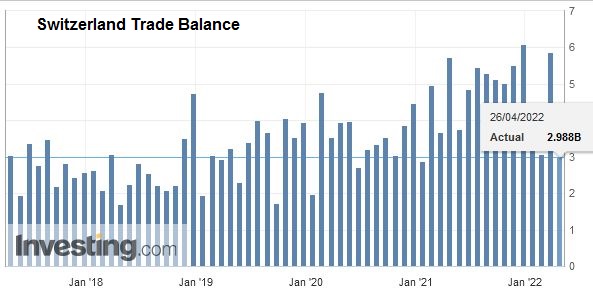
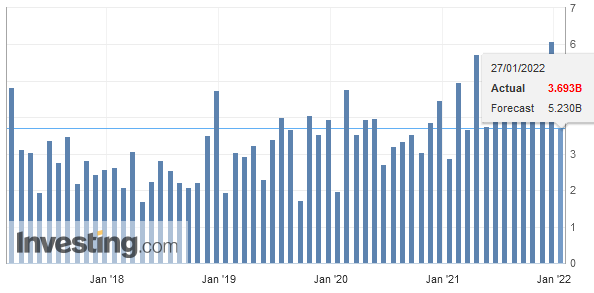
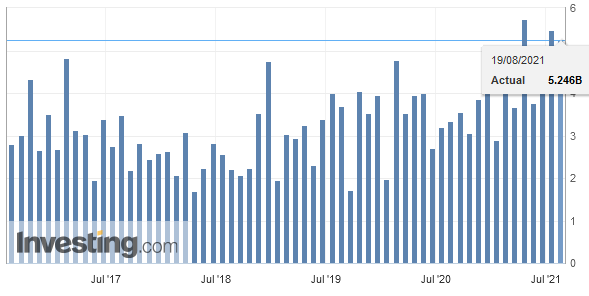
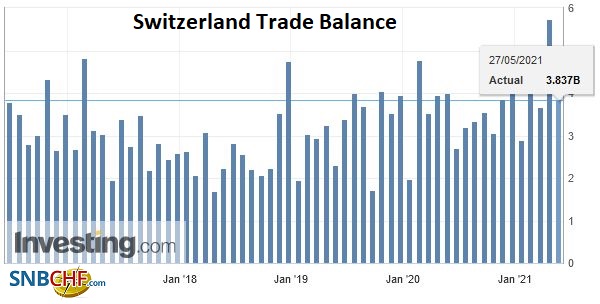
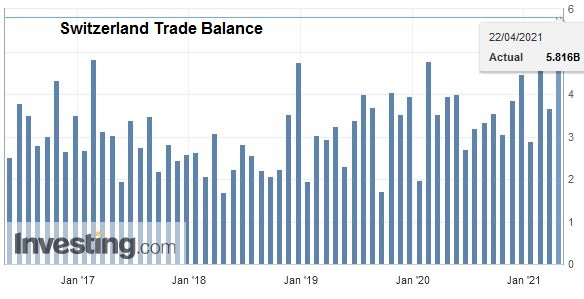
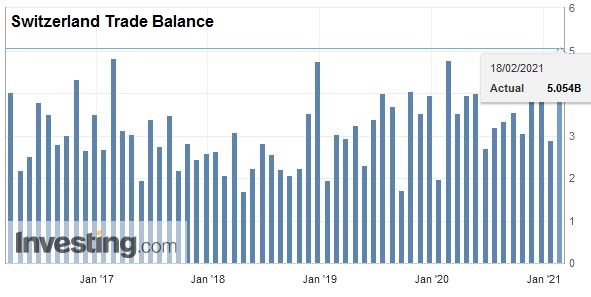
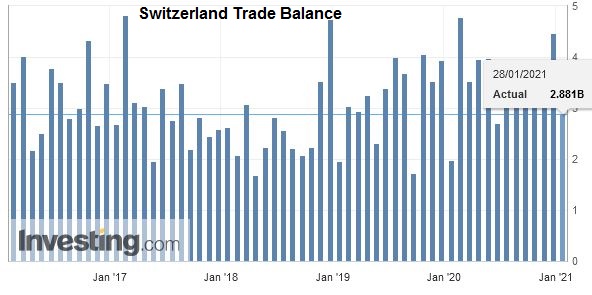
Switzerland Trade Balance, September 2017(see more posts on Switzerland Trade Balance, )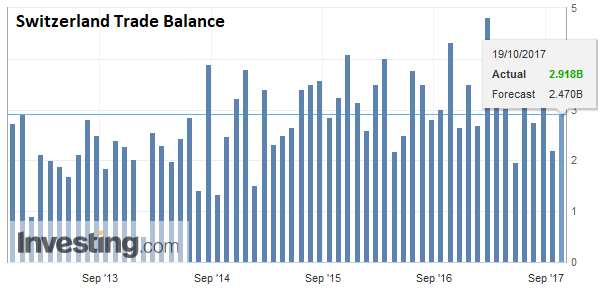 Source: Investing.com - Click to enlarge |
ExportsMEM carton industry, chemistry – pharma slows downDuring the third quarter of 2017, exports of the main merchandise groups consolidated. Only jewelry (-17%) and paper and graphic products (-2%) declined. While the hare group, chemicals and pharmaceuticals, rose shyly (+ 1%), Watchmaking sales were up 6% compared with 5% for the machinery and electronics sector. In the latter, machine tools posted + 13%. Precision instruments as well as food, beverages and tobacco (coffee: + 6%) gained 4%. In chemistry-pharma, the rise of immunological products has largely offset the fall in active ingredients.Geographically, demand in the three main markets has evolved heterogeneously. Asia (+ 7%) was the most dynamic; Singapore was the fastest growing country in the world (+ 41%), followed by Hong Kong (+ 19%) and China (+ 14%). Japan, on the other hand, plunged (-19%). The rise in North America (+ 4%) gained ground in the USA (chemicals and pharmaceuticals). In Europe (+ 1%), shipments to Russia increased by one third; Belgium, Italy and Germany also increased. The turnover with France has melted by 503 million francs (jewelery). |
Swiss Exports per Sector Q3 2017 vs. 2016(see more posts on Switzerland Exports, Switzerland Exports by Sector, )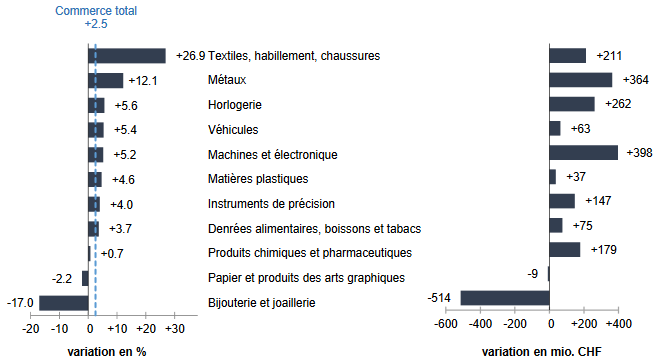 Exports by commodity group: Nominal changes adjusted for working days compared with the third quarter of 2016 Source: Swiss Customs - Click to enlarge |
ImportsImport growth widely supportedAt the entrance, almost all sectors had a smile: ten out of twelve did better than in With the exception of North America, all continents have progressed. Imports from Asia jumped 17%, driven by the United Arab Emirates (+486 million francs, jewelery). Japan and China were not outdone, up 17% and 6% respectively. On the European side (+ 6%), France, Austria, Italy and the United Kingdom climbed between 9 and 11% against 7% for Germany. Ireland, for its part, dipped (-378 million francs). The downside of North America (-10%) is due to lower deliveries of vehicles (aircraft) from the USA. September 2017: Stagnation of exports and increase in importsAfter shining in July and August, exports stagnated in the last month of the 3rd quarter of 2017. The decline in sales of chemicals and pharmaceuticals in the US mainly led to the result. Conversely, after their performance in August, imports continued their momentum (+ 10%). This progression has been based on half Asia. |
Swiss Imports per Sector Q3 2017 vs. 2016(see more posts on Switzerland Imports, Switzerland Imports by Sector, )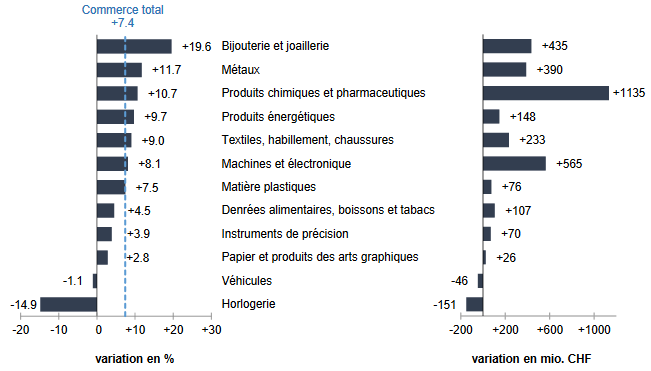 Imports by commodity group: Nominal changes adjusted for working days compared with the third quarter of 2016 Source: Swiss Customs - Click to enlarge |
Full story here Are you the author?
Tags: newslettersent,Switzerland Exports,Switzerland Exports by Sector,Switzerland Imports,Switzerland Imports by Sector,Switzerland Trade Balance