Marc Chandler
My articles My offerMy siteAbout meMy videosMy books
Follow on:LinkedINTwitterSeeking AlphaAmazon
George Dorgan
My articles My siteAbout meMy videosMy books
Follow on:LinkedINTwitterSeeking Alpha
CFA SocietyEconomicBlogs
Summary
Euro looks like it is carving out a top.
The importance also lies in identifying levels that the bearish view may be wrong.
Widening rate differentials, a likely later peak in divergence than previously anticipated, and one-sided market positioning lend support to the bearish view.
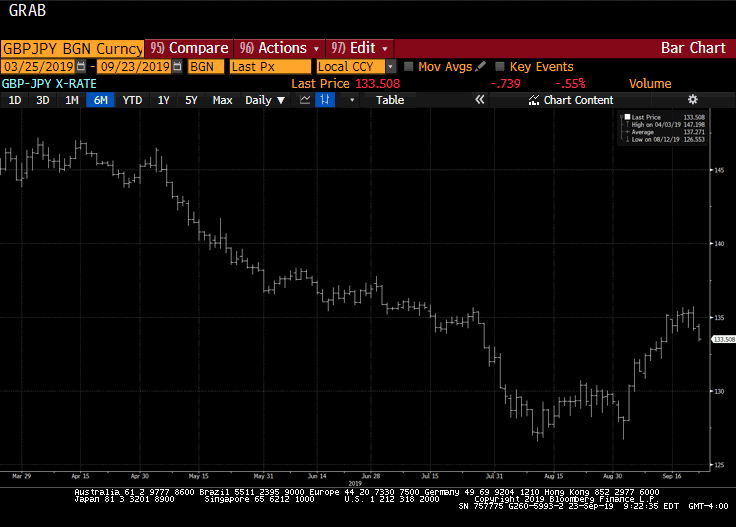
| This Great Graphic depicts the top the euro is carving. We suggest that several fundamental developments lie behind the price action. Interest rate differentials are widening interest rate differentials favoring the US. Speculative market positioning is leaning heavily long euros. European politics no longer the tailwind that it was, it is not surprising that the euro appears to be carving out a top.
There is increased speculation that the ECB’s asset purchases will continue well into next year, even if at a slower pace. The divergence between the Fed’s balance sheet that has begun shrinking and the ECB’s balance sheet has not peaked. Indeed, even if after the ECB’s balance sheet stops expanding, peak divergence lies ahead as the Fed’s balance sheet will likely continue to shrink in 2019. We had been tracking a head and shoulders topping pattern in the euro. The neckline is the shown in red. As that pattern was being traced in September, the euro fell, snapping a six-month uptrend. One of the importance of the technical patterns is that they offer a price projection. We suggested that a conservative target was $1.1600. The euro reached $1.1670 on October 6. This matched the mid-August low before the euro bounced. The white line in the chart connects that mid-August low with the early October low. It is the neckline of a larger head and shoulders pattern. Last week’s rally seemed to have formed the right shoulder. The high was around $1.1880, which also corresponded to a 50% retracement of the decline from the year’s high on September 8 near $1.2090. The left shoulder peaked near $1.1910. In essence, the first head and shoulders pattern was part of the head of a larger head and shoulders pattern. Even if one does not subscribe to technical analysis, the takeaway may be important. First, the bearish technical view would be weakened by a euro move back above the larger shoulders ($1.1880-$1.1910). Second, a break of the $1.1660 area could spur further liquidation of long euro speculative positions. A break of $1.1600 area would signal a move toward $1.1250, not far from the 50% retracement of this year’s euro advance. The technical indicators on the daily charts are not generating particularly robust signals, but signals from the weekly charts lend credence to the bearish pattern discussed. Moreover, our assessment of the macroeconomic conditions, the widening interest rate differentials, and the prospect that the ECB purchases extend longer than previously anticipated, which in turn, defers the ECB’s first rate hike supports the technical view. At the same time, the technical analysis offers a level for risk and money management purposes that would weaken this view. |
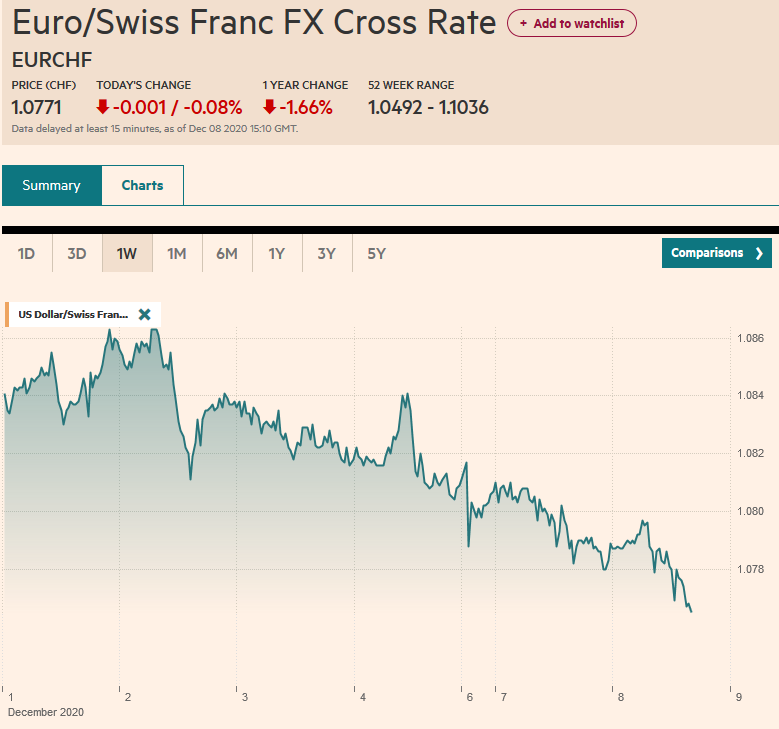
EUR/BGN Currency - Click to enlarge |
Full story here Are you the author?
Tags: $EUR,Great Graphic,newslettersent