Jeffrey P. Snider
My articles My offerMy siteAbout meMy videosMy books
Follow on:LinkedINTwitterSeeking Alpha
| All the way back in January I calculated the total size of China’s 2016 fiscal “stimulus.” Starting in January 2016, authorities conducted what was an enormous spending program. As it had twice before, the government directed increased “investment” from State-owned Enterprises (SOE).By my back-of-the-envelope numbers, the scale of this fiscal side program was about RMB 1.45 trillion, or nearly 2% of GDP. It was about the same size as the one conducted in 2012 at the start of the slowdown, and in the same category if somewhat smaller than the exercise in 2009. |
China Fixed Asses Investment, 2014 - 2016(see more posts on China Fixed Asset Investment, )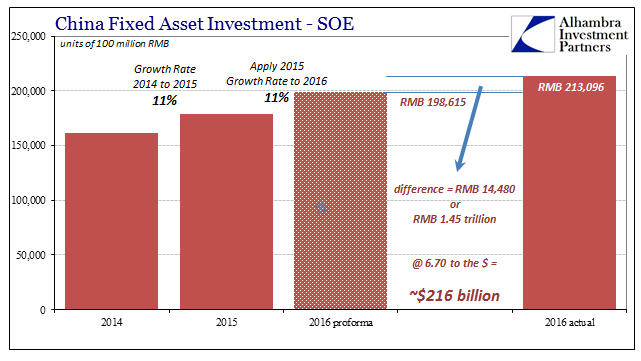 - Click to enlarge |
| With more than a year and a half passing since this last one began, and a little over a year since officials began winding it down, the economic results are becoming significant. Unfortunately, that very likely means there wasn’t even a small significant improvement in the Chinese economy for all of it.Industrial Production in August 2017 was just 6% more than in August 2016. That is the second consecutive month right back down in the same 2015-16 doldrums. To this point, and time is sufficient, the best that can be said of IP was two months total at 7.6%. That’s it. Not a single month above 8% which before the “rising dollar” was a serious floor; less than 8% was big trouble.
Now it appears that level is China’s industrial ceiling, and one seemingly far above what it might reasonably accomplish. Given that Chinese industry is reliant on global “demand” more than anything, such are the implications for the global rebound. |
China Industrial Production, Aug 1998 - 2017(see more posts on China Industrial Production, )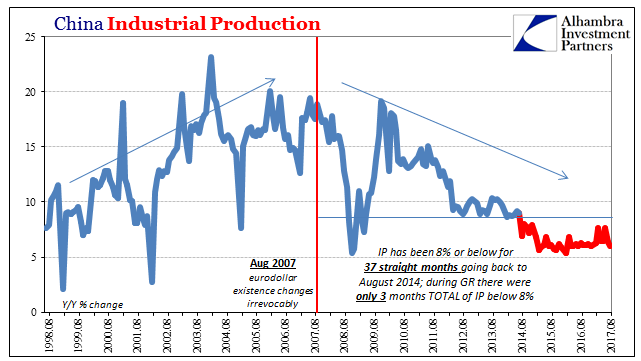 - Click to enlarge |
| Chinese retail sales also fell back into the same levels as before. Reaching 11% only once, in June, retail sales grew by just 10.1% in August. There continues to be no sign of so-called rebalancing, leaving instead a Chinese economy at best in the same position as 2015-16. |
China Industry, Feb 1999 - Aug 2017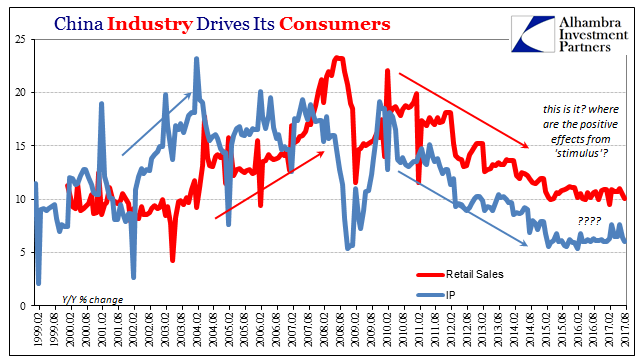 - Click to enlarge |
| The more important parts of China’s economy have been suggesting for months now something worse, that there really may be a downside already looming. Fixed Asset Investment (FAI) had turned positive on the private side perhaps as a result of the fiscal spending boost. Even if that was the case, it was entirely short-lived and never achieved much of an upside.In terms of Private FAI, middle single digit growth (monthly year-over-year) isn’t really any different than low single digits or the slight contraction of two months at the worst point last year. |
China Fixed Asset Investment, Aug 2013 - 2017(see more posts on China Fixed Asset Investment, )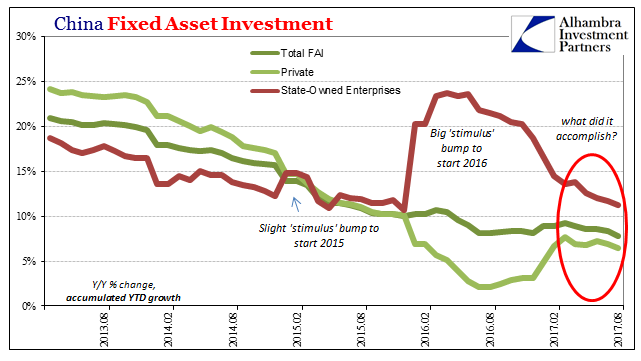 - Click to enlarge |
| The National Bureau of Statistics estimates that total Private FAI in the eight months January to August 2017 was RMB 23.9 trillion. That’s just 6.4% more than the first eight months of 2016. Working out the growth rate for August alone, the calculations show that Private FAI last month expanded by just 3.0%, a clear slowdown in activity that dates back unsurprisingly to March (when it seems the whole world shifted backward again). |
China Fixed Asset Investment, Aug 2012 - 2017(see more posts on China Fixed Asset Investment, )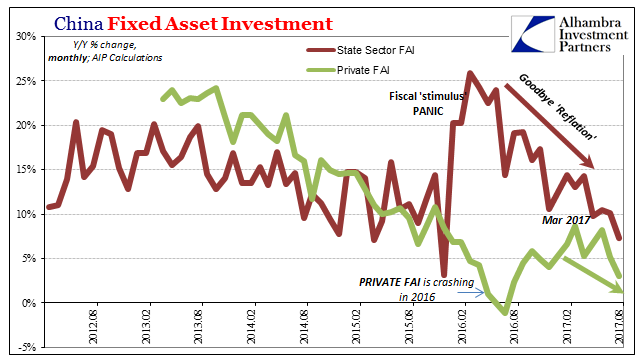 - Click to enlarge |
Private FAI is everything about China’s economy; it is its transformation from a 19th century-style agrarian basis to the glittering towers and sweeping ghost cities of the 21st century. More than that, it is, or was, the last hope for “global growth.” If we want to understand why Brazil’s economy, for example, may have stopped its nightmare contraction but since has gone no further, this is it.

In fact, central bankers in particular have talked a lot recently about “globally synchronized growth” as their primary motive for feeling upbeat about economic prospects for the first time in years. What China’s statistics show instead is that it isn’t global growth at all, but for a while the globally synchronized lack of further contraction. This is a distinction that makes all the difference.
The input of so much time and “stimulus” with nothing really to show for it at the very least demonstrates that there must be an active imbalance at work. Given a whole decade let alone the last three years, there should otherwise have been mean reversion or even random good luck that would have led to something more like normal – if that was possible. In other words, it has to be totally clear by now that there is something holding it all back, a globally synchronized anchor or drag.
Nothing authorities have done has worked; nothing that authorities will do will work, unless what they do finally do is take a deep and serious look in the last place they ever will. The problem is the eurodollar system and though it may not seem like it as much this year, it remains a big one; the big one.
Tags: $CNY,China,China Fixed Asset Investment,China Industrial Production,consumer spending,currencies,economy,EuroDollar,Federal Reserve/Monetary Policy,fixed asset investment,global growth,industrial production,Markets,newslettersent,renminbi,Retail sales,yuan