Suspicion AsleepYou have probably noticed it already: stock market volatility has recently all but disappeared. This raises an important question for every investor: Has the market established a permanent plateau of low volatility, or is the current period of low volatility just the calm before the storm? When such questions regarding future market trends arise, it is often worthwhile to examine market history. For the purpose of analyzing volatility I have used one of the longest time series available, namely the Dow Jones Industrial Average (DJIA) from 1915 onward – which represents more than a century of price history. In order to improve comparability, I have removed Saturdays, which used to be trading days in the distant past. I have calculated historical volatility as rolling and overlapping time periods of 21 trading days (equal to approximately one calendar month). |
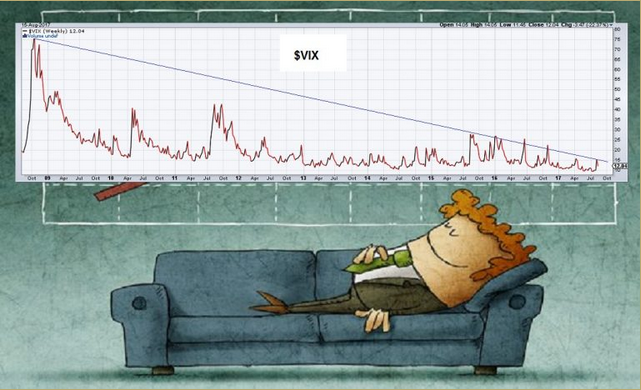 All quiet on the VIX front… what can possibly happen? - Click to enlarge |
By the Standards of the Past 100 Years Volatility is Extremely LowOn August 7 volatility measured in this way had declined to just 3.99 percent, which is a very low level indeed. By way of comparison, over the entire period of 25,734 days, volatility amounted to 15.05 percent on average! However, this isn’t the first time it stood below the level of 4 percent. Occasionally this has already happened in the past as well, for instance in 1944, 1964/65, 2011/12 and 2014. The chart shows the rolling 21-day volatility of the DJIA since 1915: |
Dow Jones: 21-Day Volatility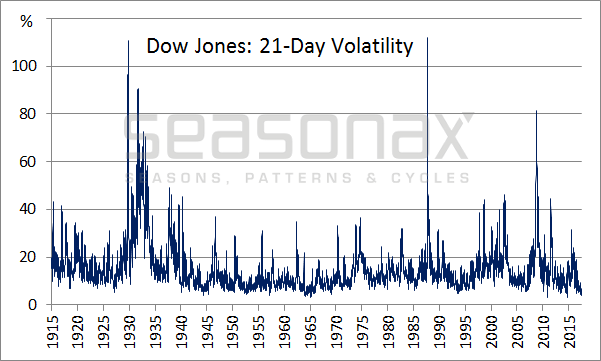 - Click to enlarge |
Volatility Can Easily Reach Much Higher LevelsLevels of volatility as low as they are currently nevertheless are very rare occurrences. Over the past century levels below 4 percent were recorded in just 0.17% of all cases. Conversely, the upside potential is considerable. To merely revert to the long-term mean of 15.05 percent would require more than a tripling from current levels. However, historical peak levels in volatility were much higher than the average: thus in 2.99 percent of all cases volatility reached levels above 50 percent, and in 0.1 percents of all cases it even exceeded 100 percent! The next chart illustrates the distribution of 21-day volatility levels of four percent and higher in the DJIA from 1915 to 2017 in one percentage point increments. Once again it can be seen quite clearly how extraordinarily low 21-day volatility levels below 4 percent are. |
Dow Jones Volatility Distribution 1915-2017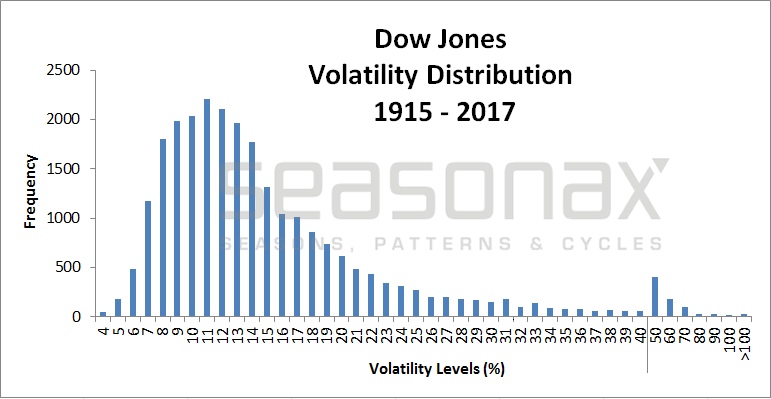 Dow Jones Industrial Average, volatility distribution, 1915 to 2017. There is substantial potential for volatility to expand - Click to enlarge |
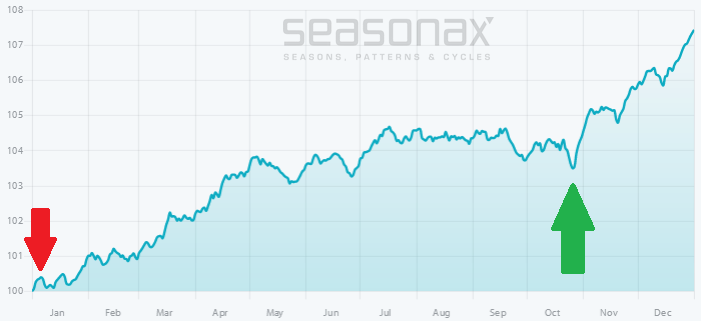
Volatility in the Course of the YearWhen should a surge in volatility be expected though? In order to find this out, we will examine the seasonal pattern. The next chart shows the seasonal trends in the 21-day volatility of the DJIA over the entire time period under investigation from 1915 onward. Note: While in the first chart above I have marked out the level of volatility at the end of the respective 21-day rolling time periods (as is usual practice), I have marked them out in the middle of the respective time periods in the chart below, as this shows the seasonal pattern more clearly. Despite the very long time period under examination with its multitude of data points, there evidently exists a very distinct seasonal pattern in stock market volatility. In July the proverbial summer doldrums can be observed, with volatility levels averaging less than 14 percent. Thereafter volatility typically increases to a peak of almost 19 percent in October. |
Dow Jones Volatility Seasonal 1915-2017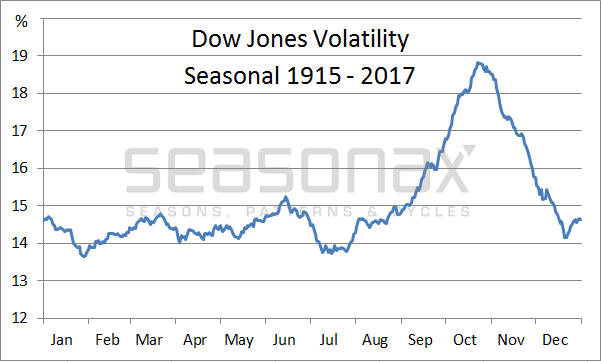 Volatility of the Dow Jones Industrial Average, seasonal pattern, 1915 to 2017. Apeak in price volatility is typically reached in October - Click to enlarge |
Low volatility is not going to persist forever!Many investors are currently betting on a further decline in volatility. In view of its already very low level and the negligible additional downside potential it offers relative to the substantial upside potential, this is probably not the best idea ever. Moreover, as shown above, October is the month in which volatility typically reaches a seasonal peak. Taking both of these facts into account, it seems far more sensible to expect an expansion in volatility. As an aside: seasonal patterns are currently barely used by traders in volatility-related instruments and their options. You stand to gain an edge over competitors by using seasonality as an input for investment decisions with respect to all financial instruments you trade. Visit www.seasonalcharts.com, or call up Seasonax on your Bloomberg professional terminal by typing in “APPS SEASON”, or access it via the App Studio in the menu of Thomson-Reuters Eikon. There you will find precise seasonal charts, event studies and much more. PS: it is probably the calm before the storm! |
 That dreaded moment when it suddenly becomes too quiet… - Click to enlarge |
Full story here Are you the author?
Tags: newslettersent,On Economy,The Stock Market