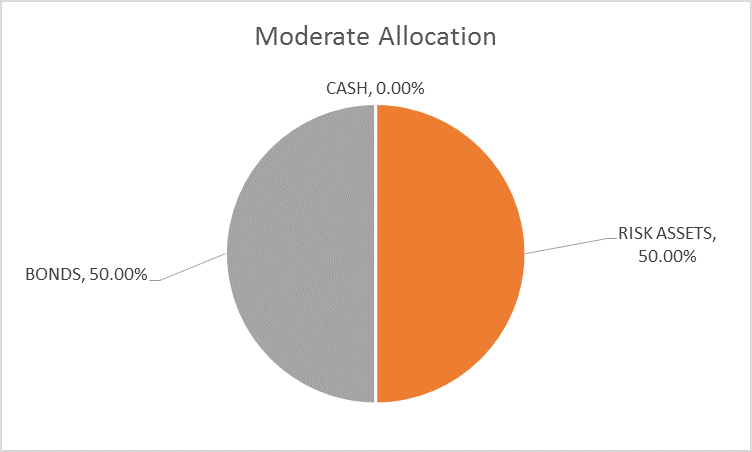
There is no change to the risk budget this month. For the moderate risk investor, the allocation between risk assets and bonds is unchanged at 50/50. There are other changes to the portfolio though so please read on.
As I write this the stock market is in the process of taking a dive (well if 1.4% is a “dive”) and one can’t help but wonder if the long awaited and anticipated correction is finally at hand. Which means, of course, that it probably isn’t because everybody is looking for it, hoping for it. And I will admit there is a temptation to make a portfolio change because it sure would feel good to take a little off right about now even though our portfolios are performing fine today. (A quick perusal of accounts shows one of our typical moderate risk accounts down about 20 basis points versus the 140 basis points of the S&P 500.) But there is no endeavor I know of where the old saw that one shouldn’t let the perfect be the enemy of the good applies more than in investing. Chasing the perfect portfolio is a fool’s errand and more often than not gets you a result that doesn’t even qualify as good.
We have an investment process so that we don’t do such things. We have set parameters that must be met to justify an asset allocation change. The baseline allocation we use is the one we developed in our Fortress Portfolio. The Fortress is a passive portfolio, a strategic design. The Alhambra, which is what we’ve dubbed these more actively managed portfolios, starts with the same strategic allocation as the Fortress. In other words, the asset allocation is the strategy. We make tactical changes to that allocation very reluctantly because the strategy has been very successful. Why else would we choose it as our strategy? If you make changes to your asset allocation every time the stock market squiggles, I hate to be the one to break it to you, but you don’t really have a strategy.
|
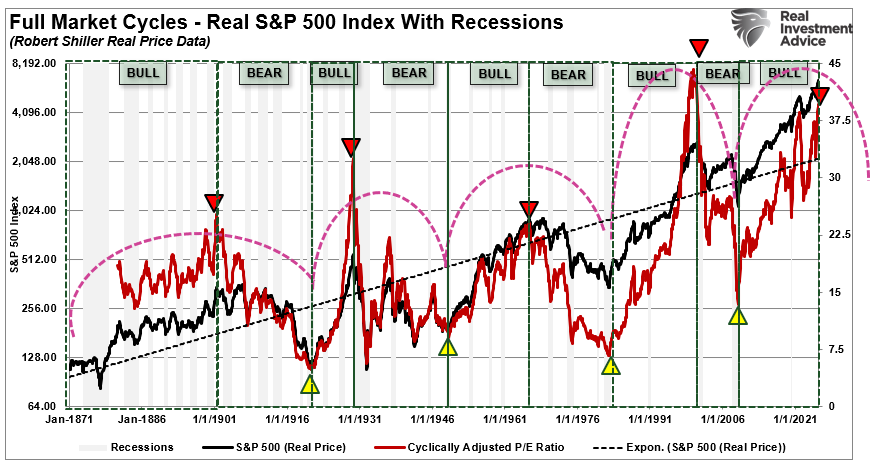
There are things that will get us to change the allocation on a tactical basis. In fact, the current risk budget represents a more conservative allocation than is normal for our moderate risk portfolio. The baseline moderate allocation is 40% bonds. It is at 50% now because stock market valuations are near all time highs and risk is elevated. History is pretty clear that when valuations are this elevated it isn’t a great time to be taking on risk. And risk matters. I think that is something too many people get wrong about this business of bear versus bull. This isn’t an all or none debate. Yes, we are bearish on valuations. I’d even go so far as to say that I believe there are some assets trading at levels that will someday be looked back on as ridiculous. So, yes, we think valuations are high. (Or the buyers of some of these assets are.) But that doesn’t mean we’ve sold all our stocks and gotten long bottled water and ammo. We have taken a prudent step and reduced our allocation to risk assets in an environment of elevated risk. That’s all. According to our process, I could reduce the risk allocation further if one of our other indicators provided a reason to do so. Right now, I don’t have any such warning. |
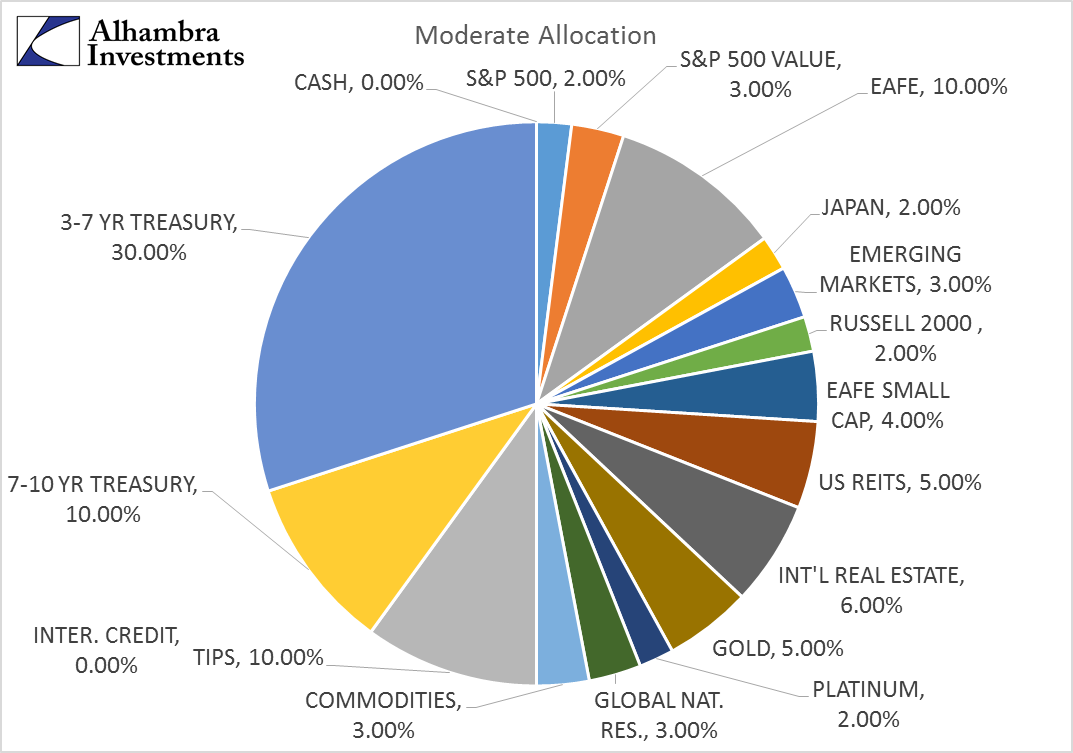
Moderate Allocation |
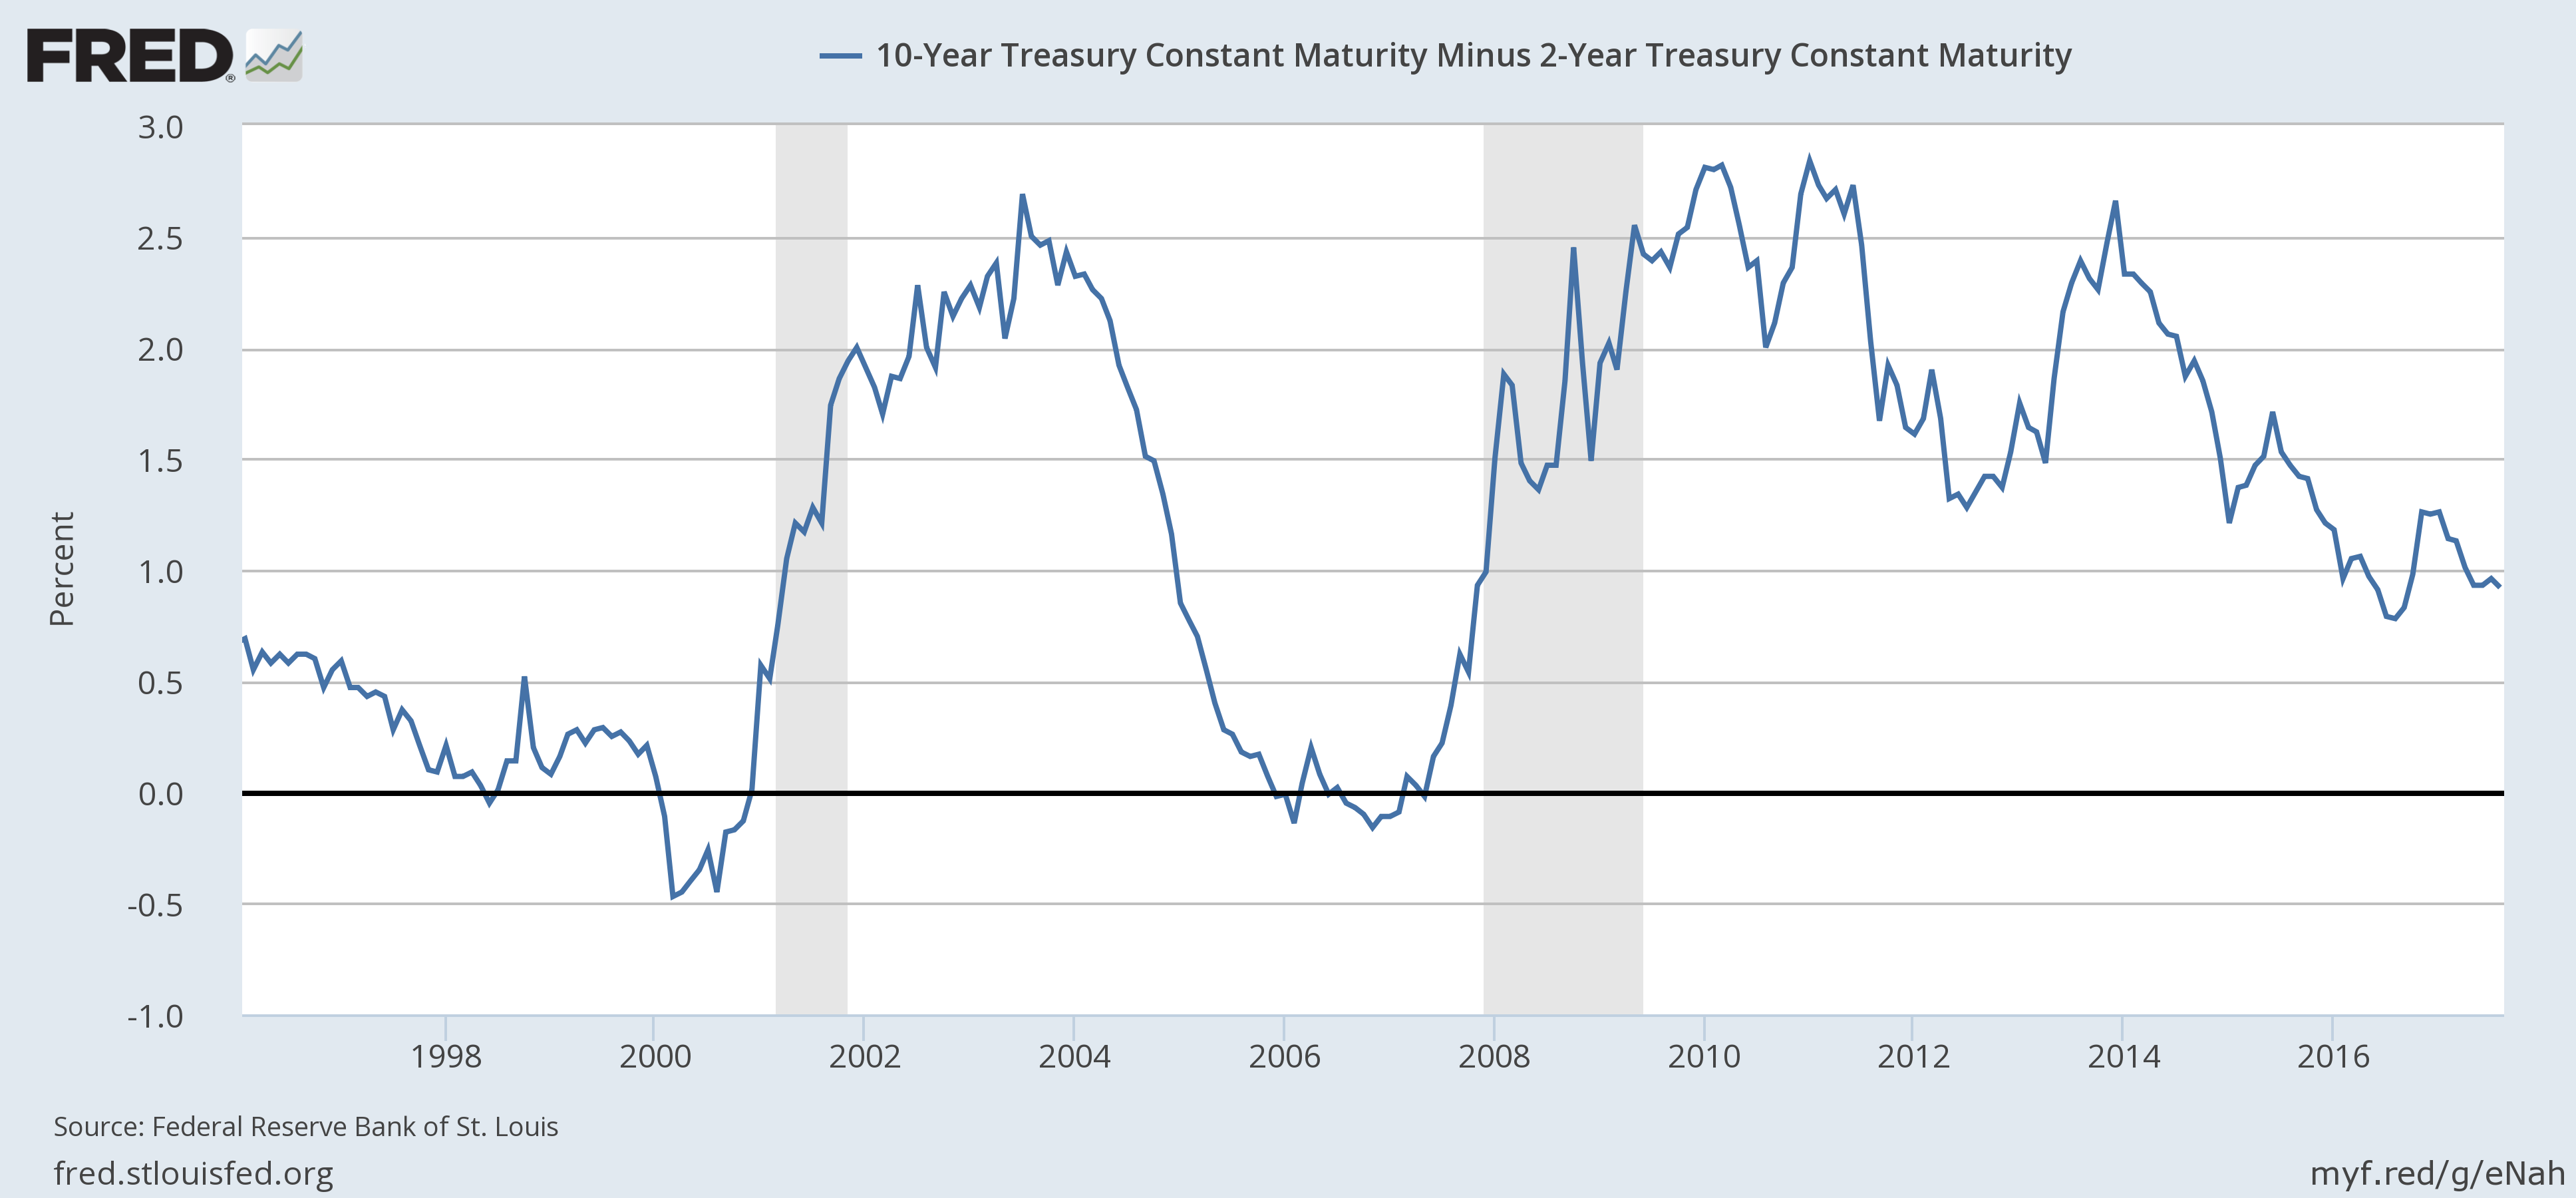
Yield CurveThe yield curve is flattening but it is still far from flat or inverted. It hasn’t changed much recently, just 3 basis points flatter than a month ago. I have written many times that we don’t know how effective the yield curve will be at predicting the next recession. It has been a wonderful indicator in the past – if not very timely – but with rates so low, who knows whether it will get to fully flat before recession? We aren’t actually looking for a flat curve anyway. What we are looking for, the real indicator of imminent recession, is a rapid steepening that happens because short term rates collapse in anticipation of Fed action. Of course, we don’t know if that one will work this cycle either, so, rather than just say that recession is unlikely because the curve isn’t flat yet, I’ll just say that nothing has happened with the curve to cause us additional concern. Our process isn’t completely objective based on rules only. Sometimes human judgment is not only allowed but encouraged. |
U.S. 10 Year Treasury Constant Maturity, 1998-2016(see more posts on U.S. Treasuries, ) |
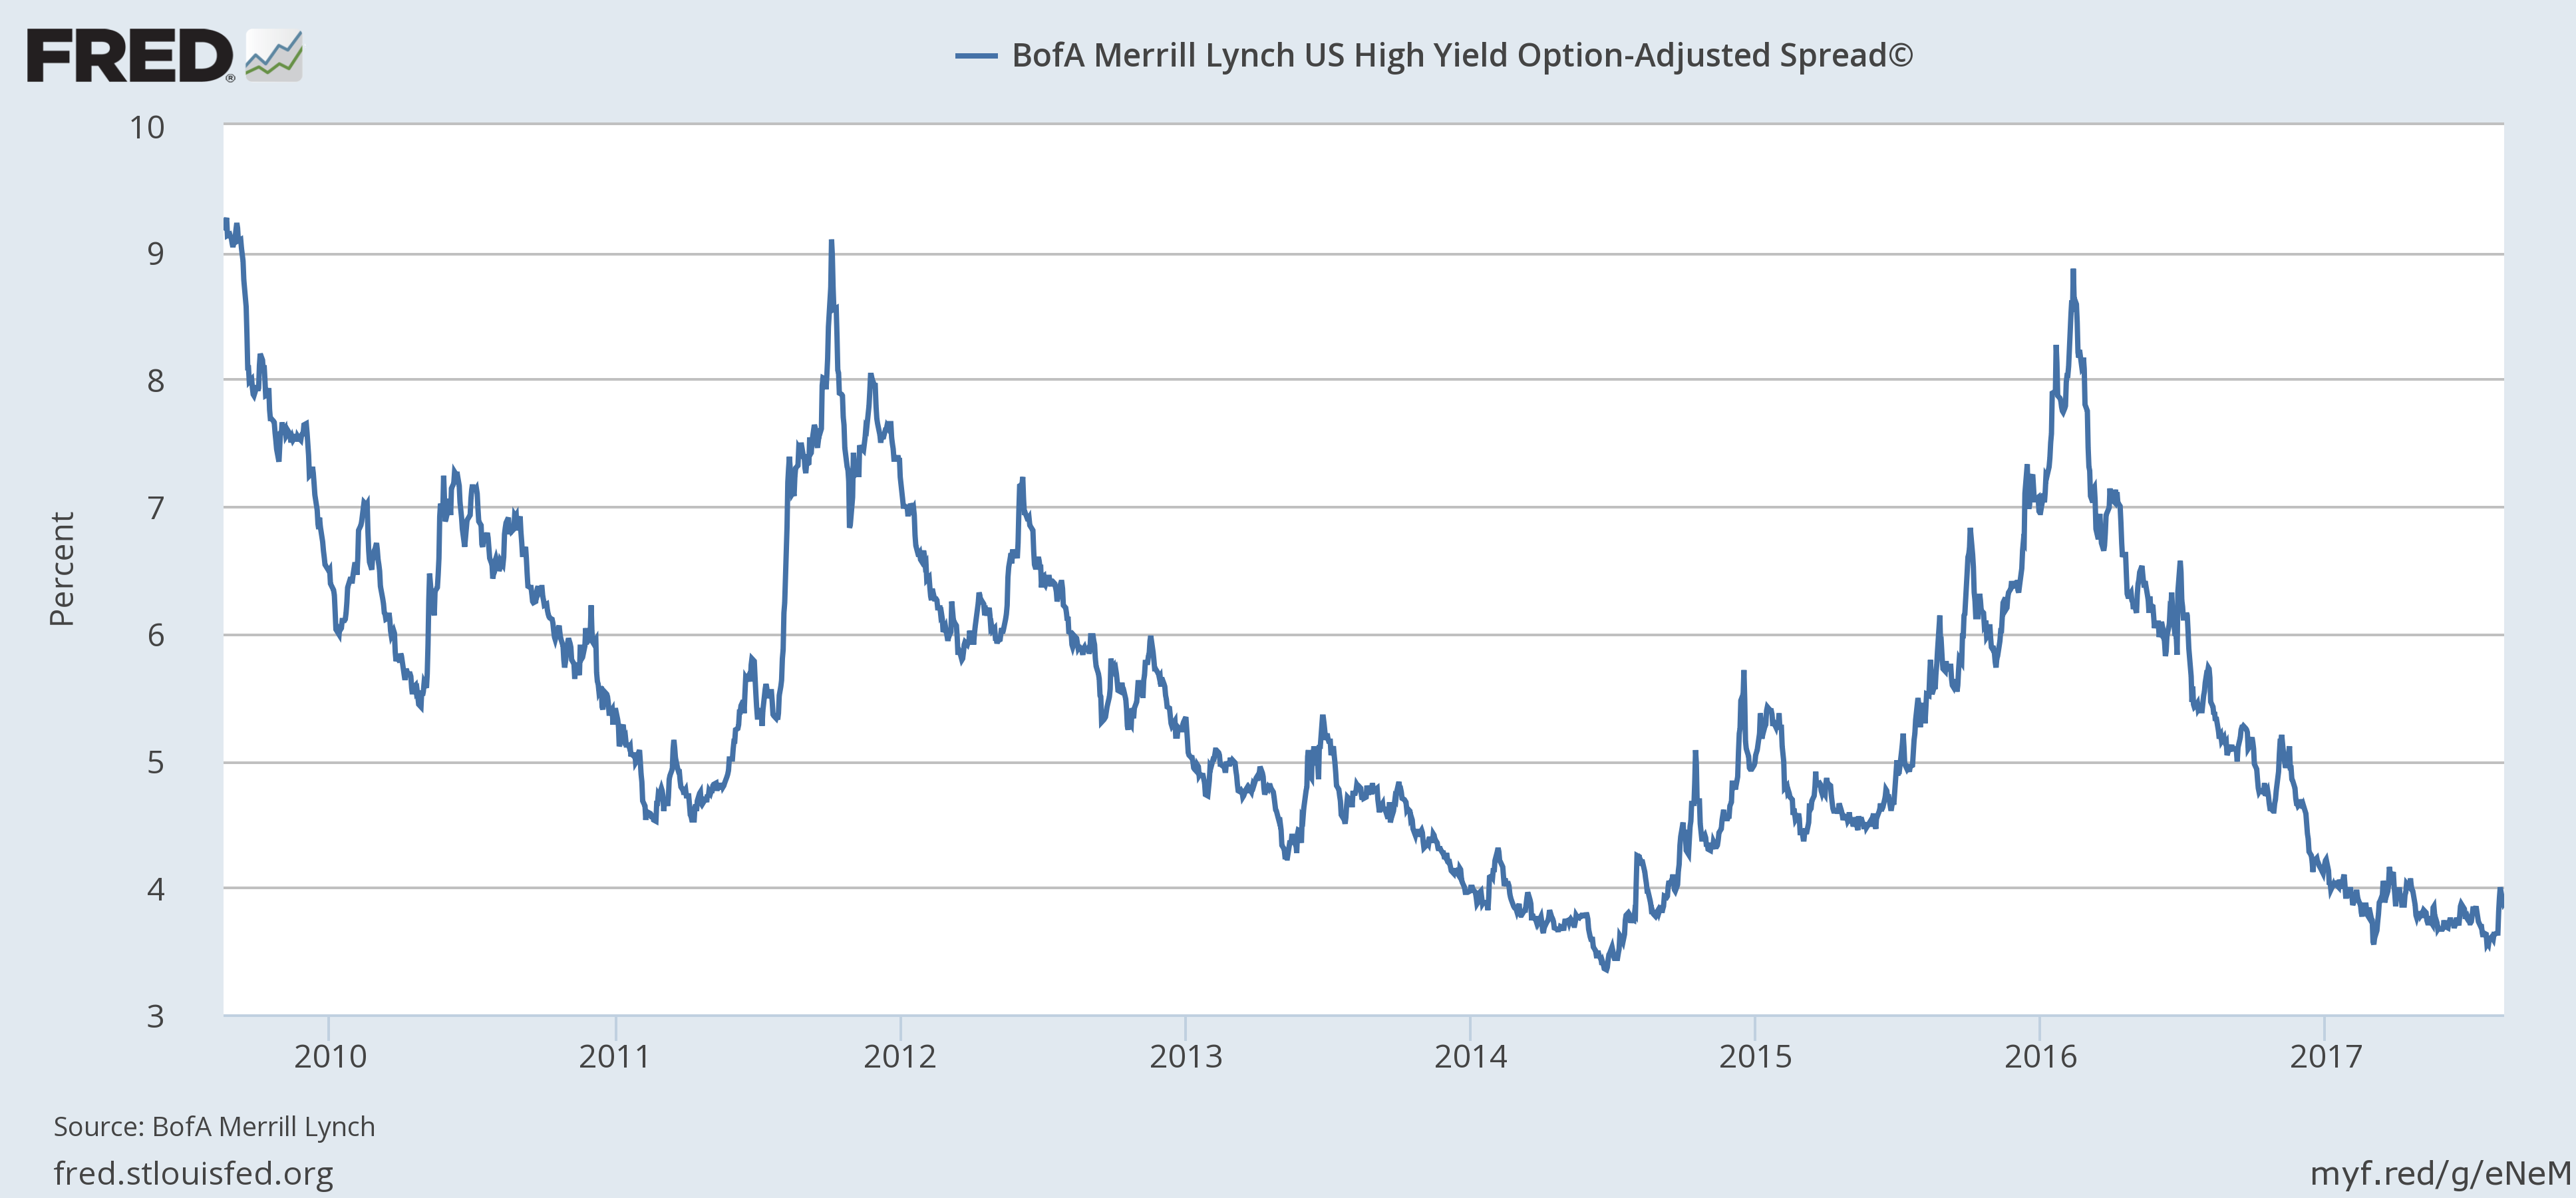
Credit SpreadsCredit spreads moved wider across the rating spectrum over the last month. High yield spreads widened by 15 basis points since the last update but are actually 33 basis points off the recent lows. While that is a fairly significant move in a short time it isn’t sufficient to warrant a change. That 9% move from low to recent high is fairly routine. We had a 13% move just last October during the little stock market correction that preceded the election and that turned out to be nothing but a head fake. I do have a sneaky suspicion that this one might turn into a little more but I don’t have anything other than a gut feel to back that up. |
BofA Merrill Lynch U.S. High Yield Option - Adjusted Spread 2010-2017 |
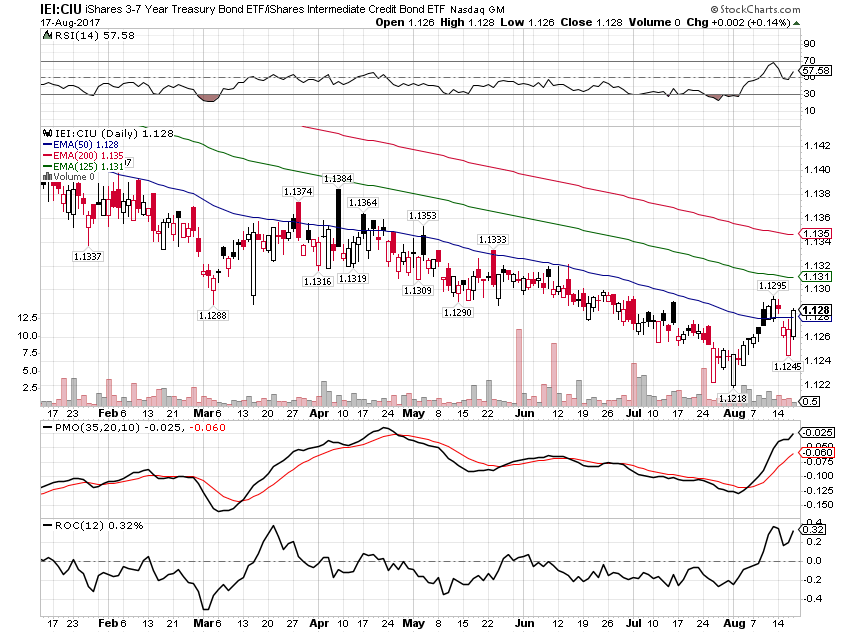
| While spreads haven’t move enough to make a change to the risk budget, that doesn’t preclude changes within asset classes. Momentum is shifting in the bond market with corporate bonds losing momentum to Treasuries (that’s what a spread widening is). I am making a change in the bond allocation, selling CIU and adding to the 3-7 year Treasury index ETF. It isn’t a big change but I don’t see much upside to holding credit at this point. Even after the recent widening, spreads are about as narrow as they get, at least if history is any guide at all. |
U.S. Treasury Bond(see more posts on U.S. Treasuries, ) |
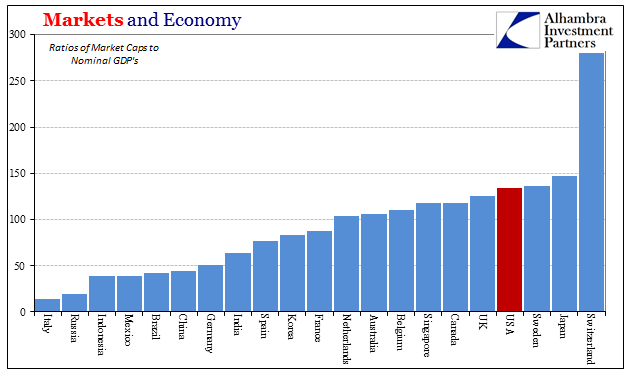
ValuationsJeff and I wrote a post last week that covers the details on stock market valuations. You can read that here. To sum it up, there are some really expensive markets in the world and there are some really cheap markets in the world. The US isn’t the most expensive but it is near the top of the list. The cheap markets are mostly Emerging Markets and Europe. That is as it has been for several years which should be a clue that cheap or expensive isn’t a very good timing tool. But EM, Europe and just more generally anything not US dollar denominated have outperformed this year. And that will probably continue to be the case as long as the dollar stays weak. |
Markets and Economy |
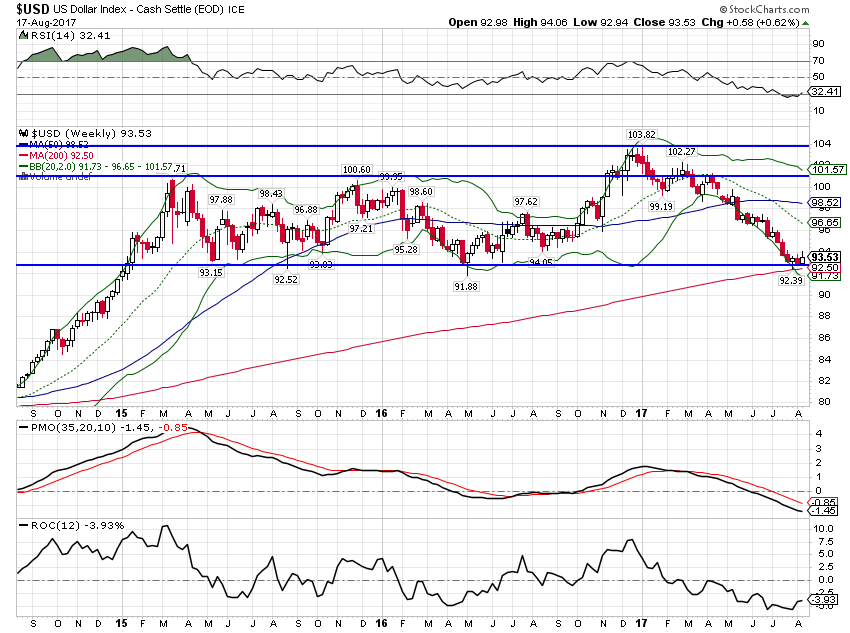
MomentumMomentum still favors international, non-US dollar assets over dollar denominated. It has waned somewhat in recent days though as the dollar has refused to either break down or rally. |
US Dollar Index - Cash Settle(see more posts on U.S. Dollar Index, ) |
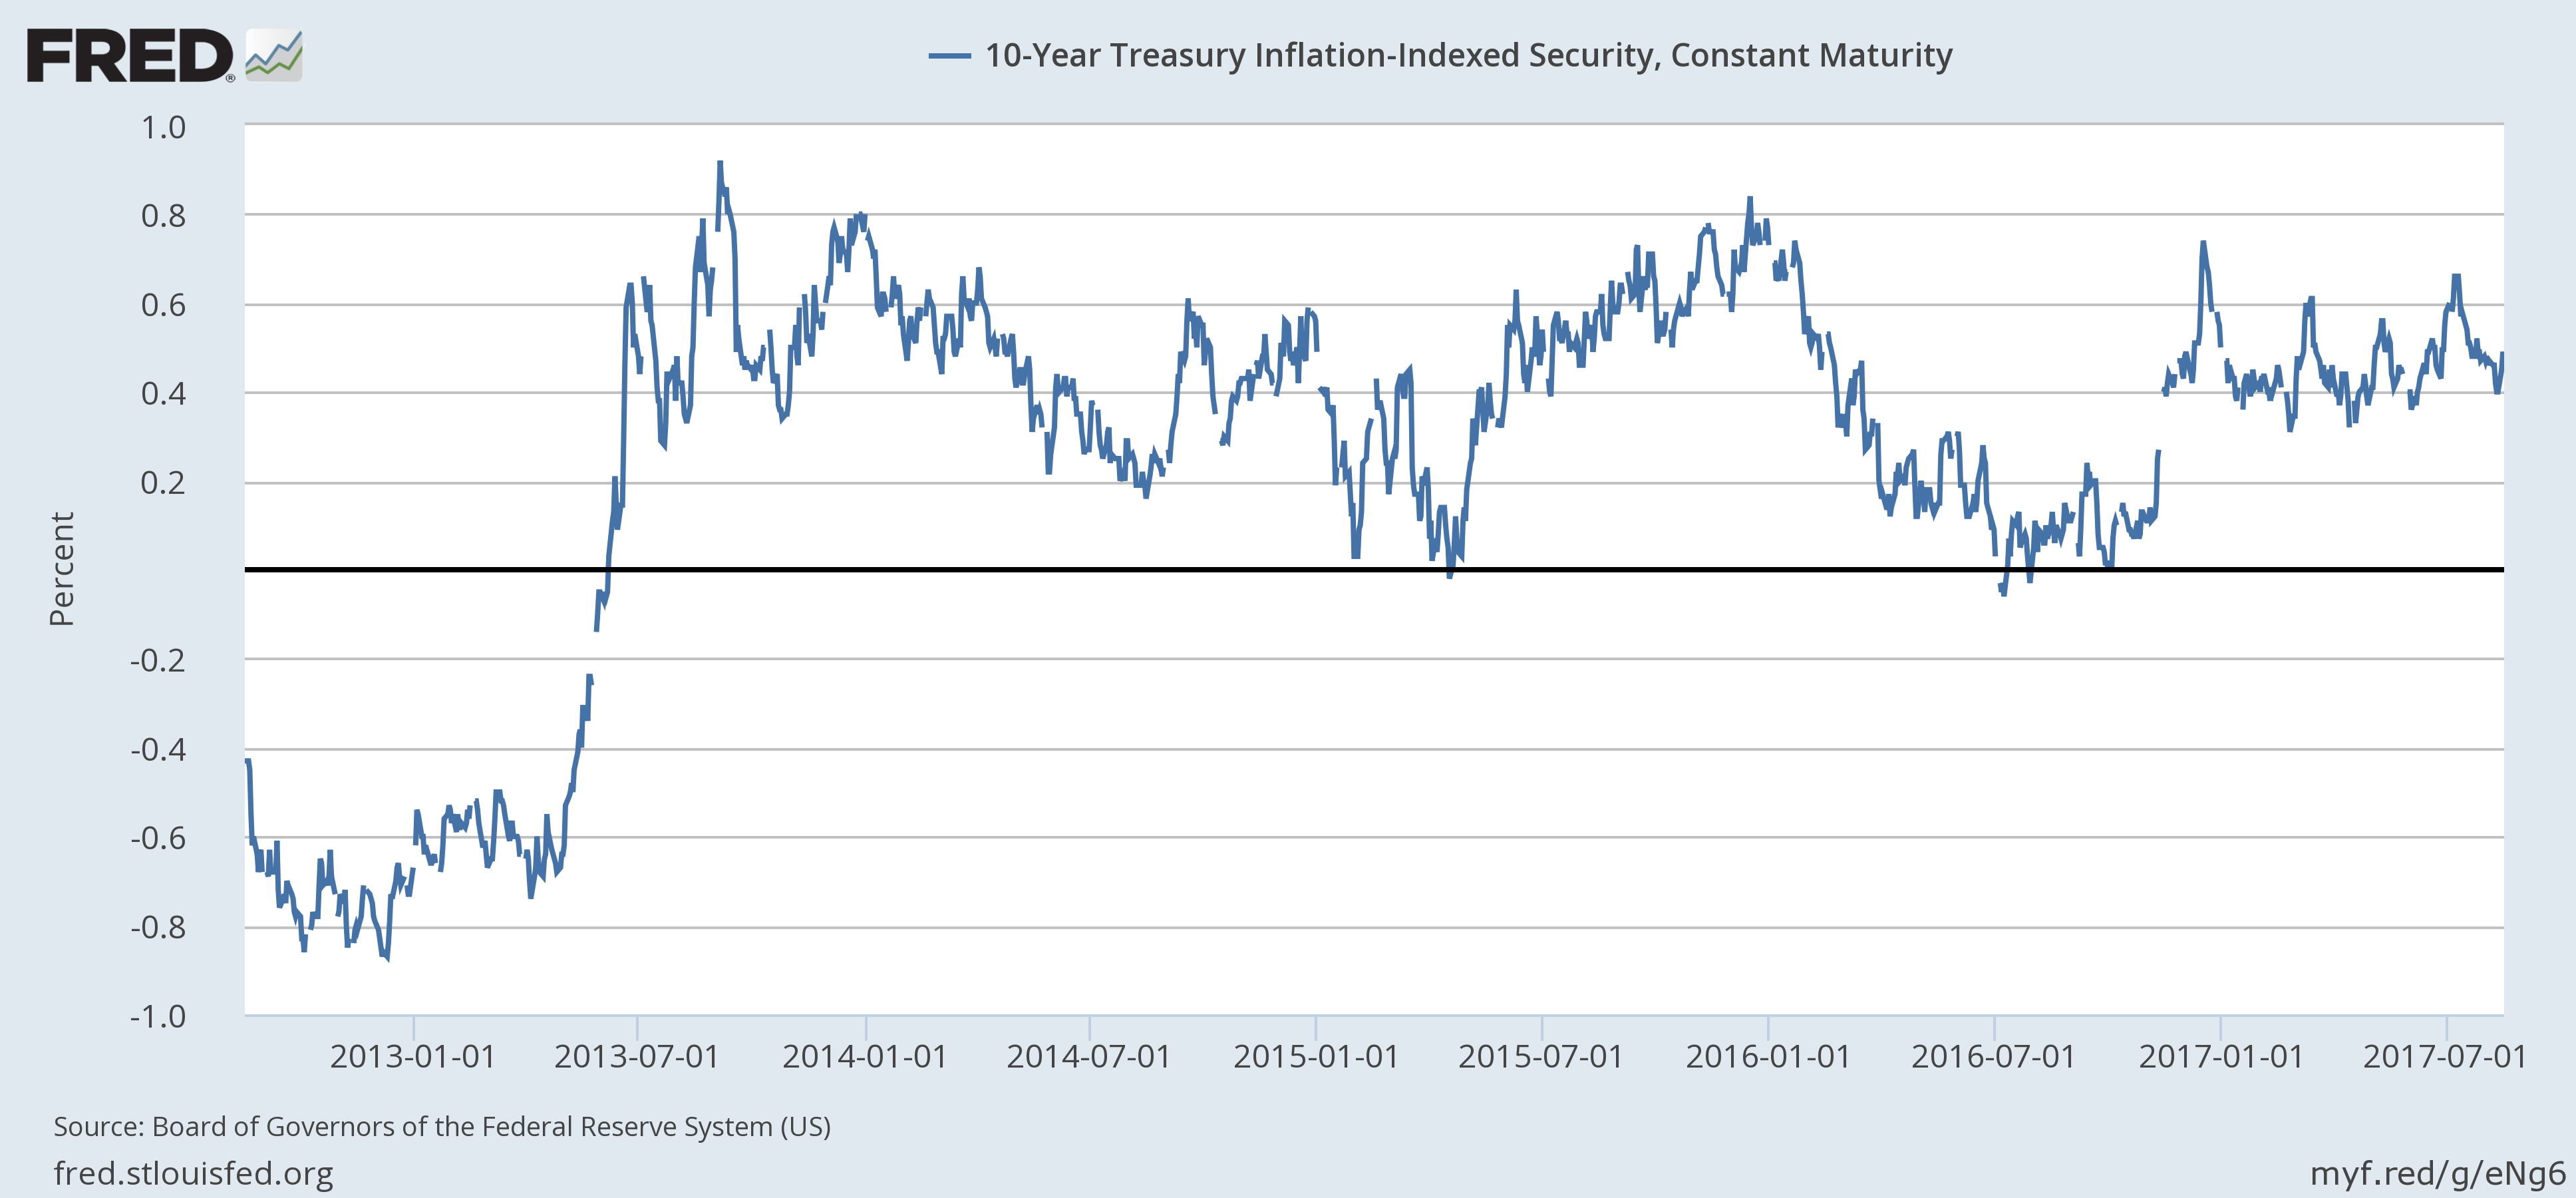
| I think the most likely outcome is that the dollar consolidates near these levels. The dollar and gold both respond to changes in real interest rates, among other things, but there is no clear trend in real rates either. |
U.S. 10 Year Treasury Inflation - Indexed Security, Jan 2013- 2017(see more posts on U.S. Treasuries, ) |
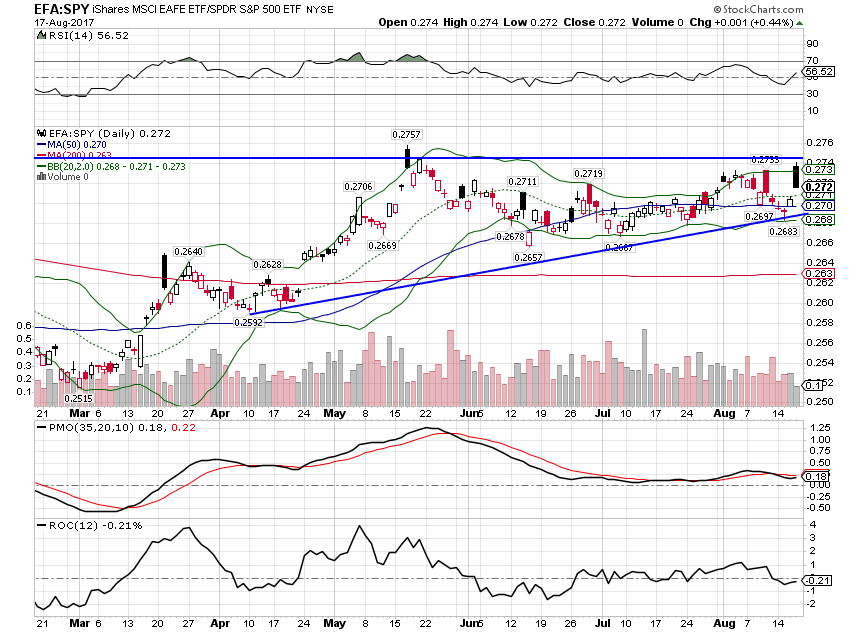
| EAFE is outperforming the S&P 500 YTD and over the last year. But over the last three months the S&P 500 has a slight lead. And that is even as the dollar has fallen so the underlying stock markets haven’t done as well in local currency terms. That is so because a rising currency is seen as a negative by many policymakers and investors alike. It is true, to some degree, that a rising currency is a tightening of monetary conditions but a rising currency also attracts capital flows which are a positive. Economic and earnings growth is currently higher in Europe and Japan versus the US so there is fundamental support for the trend. The dollar though is the key for US investors. For these markets to outperform the US, it is very helpful to be making a few bucks on the currency. |
S&P 500 ETF, Mar - Aug |
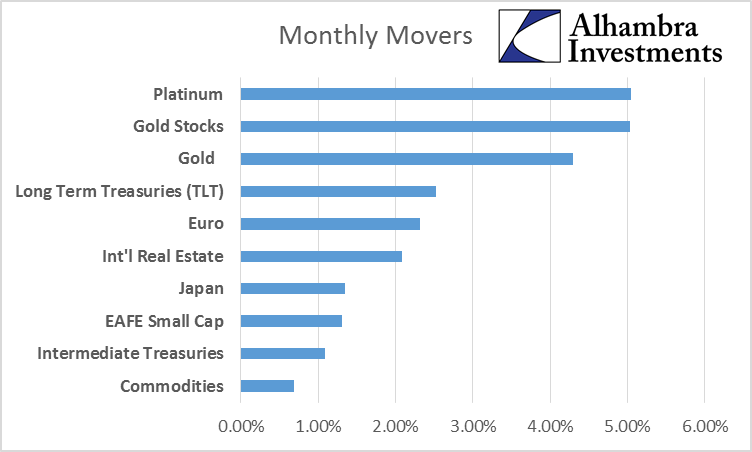
| Most of what we see near the top of a list of big movers for the month are dollar driven or related. |
Monthly Movers |
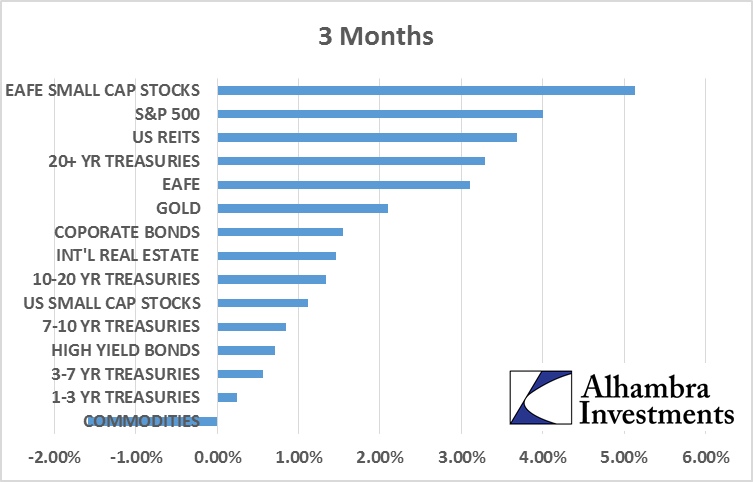
| Looking a little longer and broader we find a similar effect with one glaring exception – commodities. Commodities generally perform well in weak dollar environments but there is a growth component involved as well; you might just notice that long term Treasuries are also prominent on this list. Oil is also a large weight in commodity indexes and has been weak recently. That may change though as shale companies are cutting back on capex and inventories have recently started to drop. |
3 Month Return |
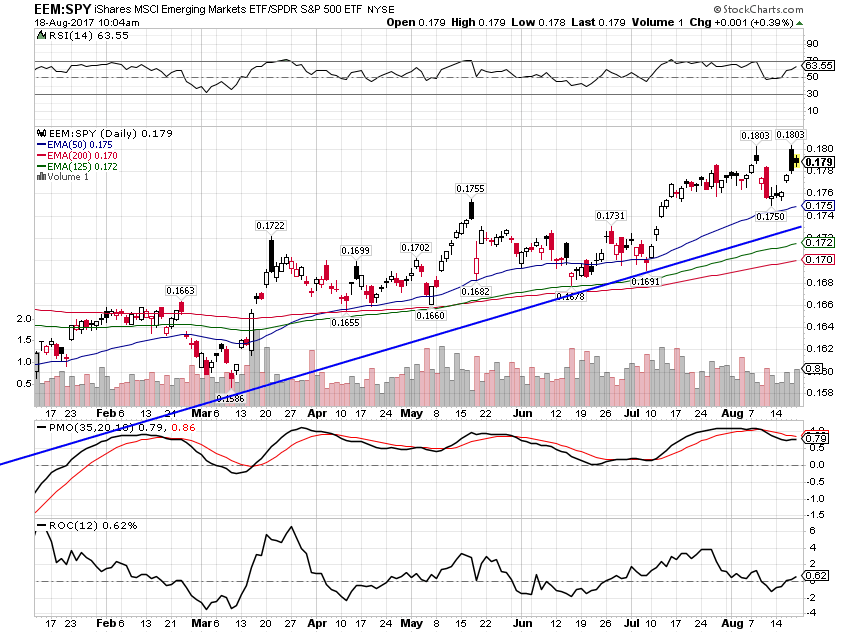
| Emerging market stocks, like their developed cousins in the EAFE, have also outperformed the S&P 500 this year. And unlike the EAFE, its uptrend has not stalled. I am a little skeptical of the trend but we do have an allocation to the asset class. EM markets and economies, much more so than larger, developed markets, are very sensitive to capital flows. For now, investors are willing to embrace the risk of EM as the dollar falls but if the US falls into recession that is unlikely to persist. And when capital flows reverse, EM markets do not perform well – to say the least. |
MSCI Emerging Markets |
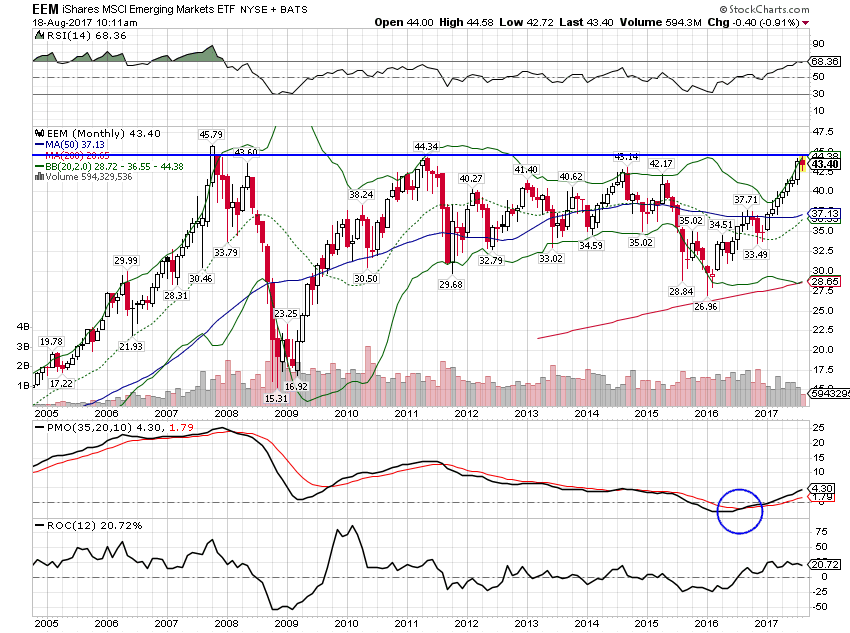
| From a technical standpoint EM stocks are bumping up against a resistance level that has proven, so far, impossible to break through. A pullback from here would not be shocking in the least. |
MSCI Emerging Markets ETF 2005-2017 |
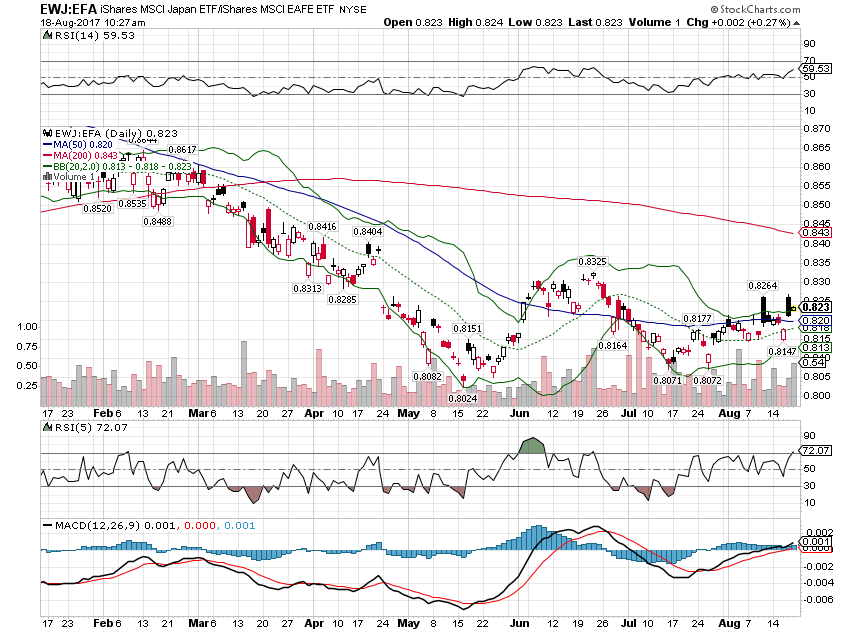
| We also hold a position in Japan which has basically been a wash versus the S&P 500 but has lagged EAFE until just recently. |
MSCI Japan ETF / MSCI EAFE ETF |
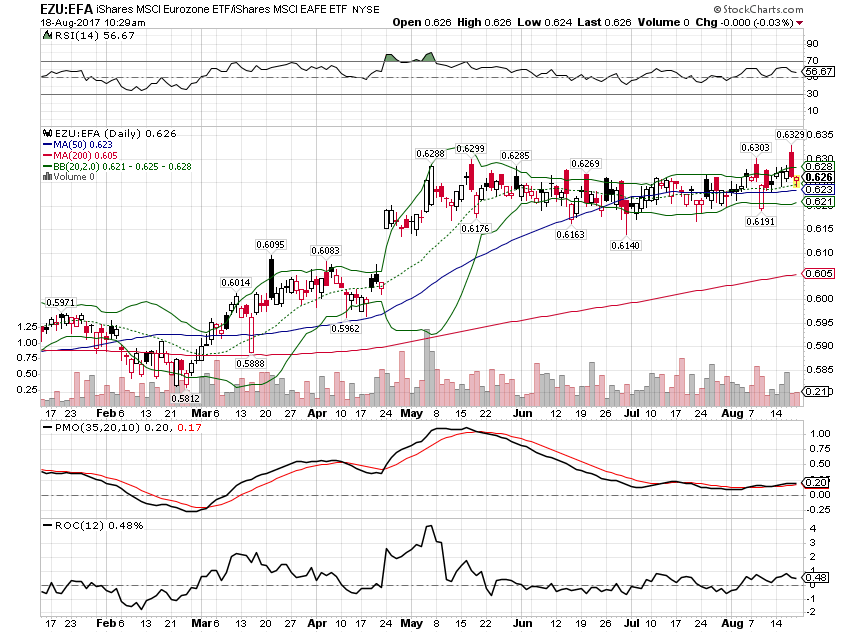
| EAFE outperformance has really been driven by Europe although the trend has stalled over the last 3 months. |
MSCI Eurozone ETF / MSCI EAFE ETF |
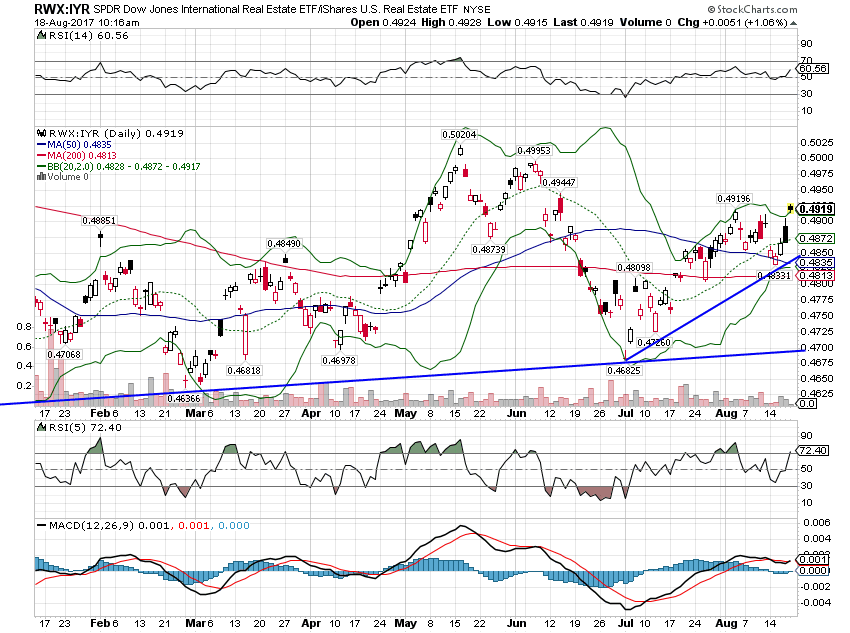
| In real estate, international assets are also outperforming US but the trend is more tentative. Recently, the trend has re-accelerated: |
Dow Jones International Real Estate, Feb - Aug(see more posts on Dow Jones, ) |
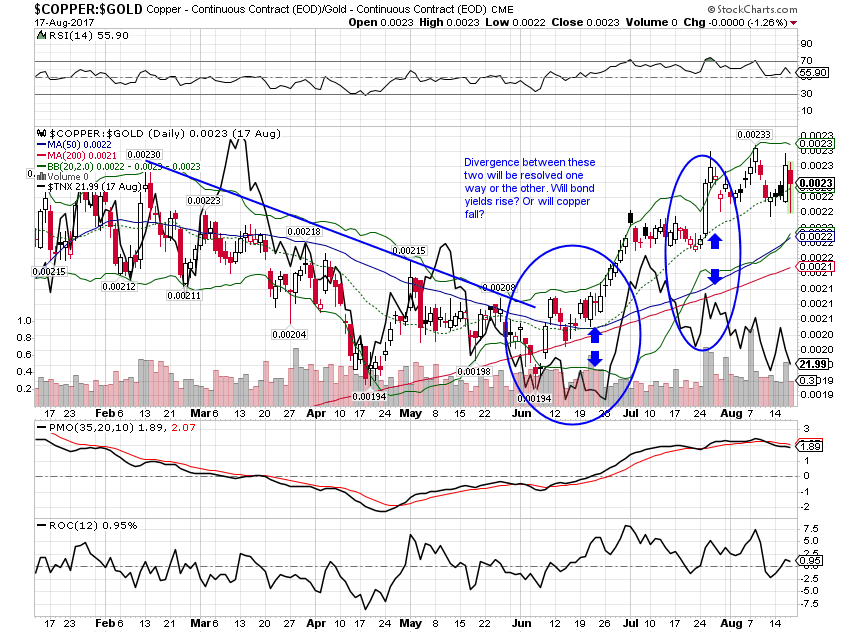
| One last trend we’re watching very closely is the divergence between the 10 year Treasury yield and the copper:gold ratio. Copper:gold is still rising, an indication of growth, while bond yields are falling. This will get resolved eventually and if I had to wager, I’d put my money on the bond market. |
Copper / Gold Contract, Feb- Aug |
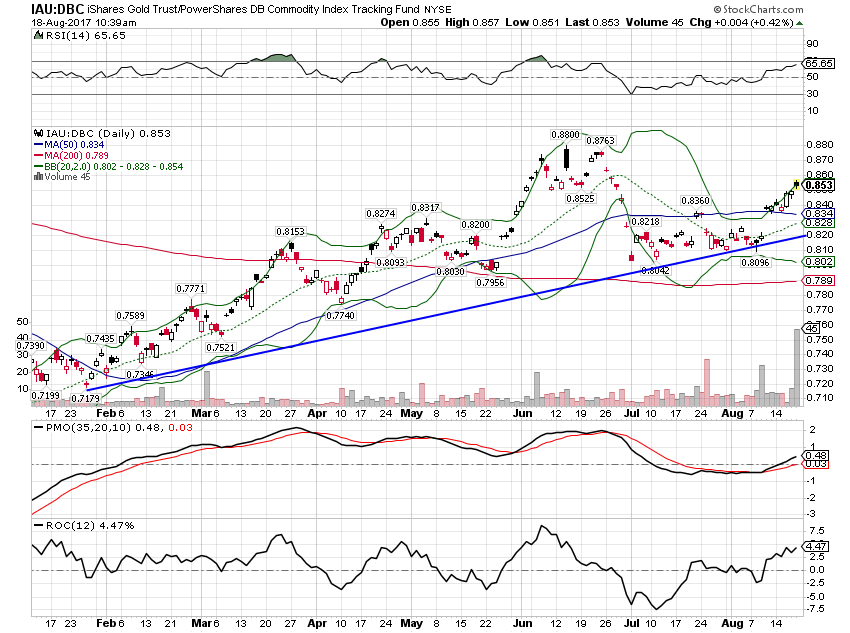
| One clue to how this gets resolved might be that gold has already turned higher against a more general commodity index ETF. There are a lot of factors at play here though, political as well as economic. Can gold break out above $1300 just based on political concerns? Well, it is right now intraday; we’ll see whether it holds. |
Gold and DB Commodity Index, Feb-Aug(see more posts on Gold, ) |
| The recent rise in gold is interesting as it appears to be driven more by political – and geo-political – concerns than just the direction of the dollar. But of course, the dollar isn’t falling in a vacuum. The Trump administration has made it clear they prefer a weaker dollar and markets pay attention to such things. In addition, hope for economic policy changes is waning fast as the Trump administration continues to flounder. Call it what you want, but to me the biggest fault of the Trump crew is their sheer incompetence. They don’t seem to have a clue how to win friends and influence people as the old book title once promised.
I don’t see any reason for other changes to the portfolio this month. There just isn’t sufficient movement in our indicators to warrant an asset allocation change. And our portfolio is already positioned to take advantage of the momentum trends. Steady as she goes…. |
Moderate Allocation |
Tags: Alhambra Research,Asset allocation,Bonds,commodities,Copper,credit,credit spreads,currencies,Dow Jones,eafe,Emerging Markets,Europe,Global Asset Allocation Update,Gold,Interest rates,Investing,Japan,Markets,Model Portfolios,momentum,newslettersent,Real Estate,real interest rates,REITs,stocks,U.S. Dollar Index,U.S. Treasuries,US dollar,valuations,Yield Curve


