Old TruismReaders are surely aware of the saying “sell in May and go away”. It is one of the best-known and oldest stock market truisms. And the saying is justified. In my article “Sell in May and Go Away – in 9 out of 11 Countries it Makes Sense to Do So” in the May 01 2017 issue of Seasonal Insights I examined the so-called Halloween effect in great detail. The result: in just two out of eleven international stock markets does it make sense to invest during the summer months. But is “sell in May” really the best recommendation? After all, it is merely a saying based on general experience. We will take a closer look at the seasonal pattern below. |
![October meetings after you forgot to sell in May [PT]](https://snbchf.com/wp-content/uploads/2017/07/dont-worry.png) October meetings after you forgot to sell in May [PT] |
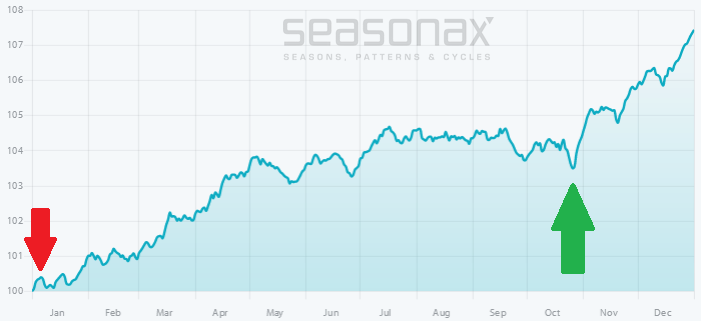
The Precise Seasonal Pattern of the Russell 2000 IndexThe small and mid-cap index Russell 2000 exhibits particularly pronounced seasonal trends. That makes it very useful for the purpose of seasonal analysis. Unlike a standard price chart, the seasonal chart of the Russell 2000 depicts the average pattern that emerges in the index in the course of a year. The horizontal axis shows the time of the year, the vertical axis the average percentage changes over the past 30 years. The seasonal trends of the index can be discerned precisely at a glance. As can be seen, the Russell 2000 does indeed typically decline between May and October. However, there is one last surge into a mid July interim peak before it actually begins to fall rather noticeably. This underscores that it is important to analyze seasonal trends with precision. The period of seasonal weakness in the Russell 2000 Index is highlighted in dark blue on the chart. It begins on July 15 and ends on October 27. |
Russell 2000 Index, Based on 30 Years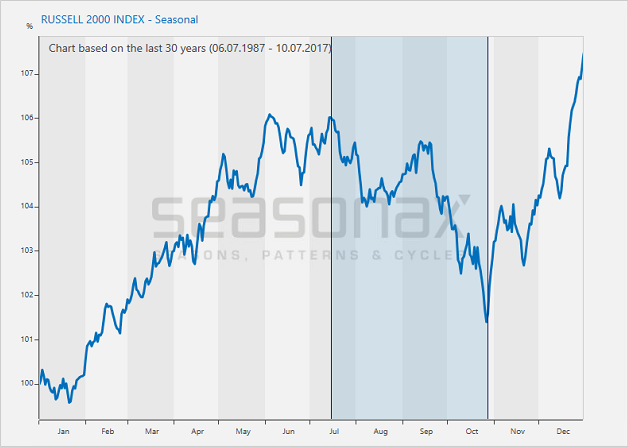 Russell 2000 Index, seasonal pattern over the past 30 years – the Russell 2000 enters a period of seasonal weakness in mid July. - Click to enlarge |
The Russell 2000 Declined in 17 of 30 Cases in the Seasonally Weak PeriodBut what were the returns of the index in individual years? The following bar chart shows the return generated by the Russell 2000 Index between July 15 and October 27 in every single year since 1987. As you can see, the color red clearly predominates. Not only did losses occur more frequently, on average they also tended to be larger than the gains. In other words, short positions not only had a greater average win rate than long positions, they also delivered higher average profits. |
Russell 2000 Index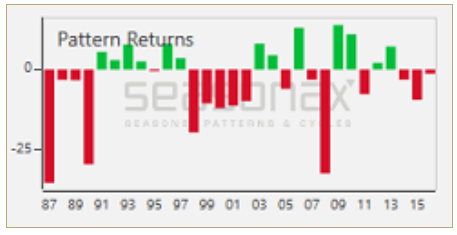 Russell 2000 Index, percentage return between July 15 and October 27 in every year since 1987. On three occasions the index suffered losses in excess of 25 percent. - Click to enlarge |
Examine the Seasonal Trends of Other Instruments as Well
What seasonal patterns are displayed by other stock market indexes, or commodities, bonds and currencies?
To find out, either go to www.seasonalcharts.com, or call up the Seasonax app by typing in “APPS SEASON” on a Bloomberg Professional Terminal or alternatively access it through the App Studio in the menu of Thomson-Reuters Eikon. You will find precise seasonal charts there and much more.
Charts by: Seasonax
Image captions by PT
Full story here Are you the author?
Tags: newslettersent,On Economy,The Stock Market