Jeffrey P. Snider
My articles My offerMy siteAbout meMy videosMy books
Follow on:LinkedINTwitterSeeking Alpha
| Both US manufacturing PMI’s underwhelmed just as those from China did. The IHS Markit Index was lower than the flash reading and the lowest level since last September. For May 2017, it registered 52.7, down from 52.8 in April and a high of 55.0 in January. Just by description alone you can appreciate exactly what pattern that fits.
The ISM Manufacturing PMI was slightly higher in May than April, 54.9 versus 54.8, but still down from a February peak at 57.7. The ISM Manufacturing PMI was slightly higher in May than April, 54.9 versus 54.8, but still down from a February peak at 57.7. |
ISM Manufacturing PMI, July 2014 - May 2017(see more posts on U.S. ISM Manufacturing PMI, )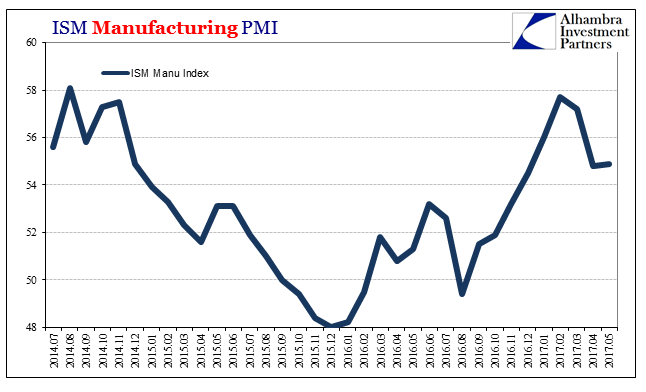 - Click to enlarge |
| There remains even on this slight downshift a “sentiment premium”, as the various PMI indices are still out ahead of so-called hard data. The correlation between the ISM Manufacturing account and durable goods orders remains the same as it has been since the 2012 slowdown. The former is significantly above what might be indicated by the latter. Or, the other way around, an ISM near 55 “should” be consistent with durable goods orders growing at 10% not 4%. |
ISM Manufacturing PMI, January 1993 - May 2017(see more posts on U.S. ISM Manufacturing PMI, ) - Click to enlarge |
| What remains perhaps most important about these PMI’s is not their relation to 50 or even that “sentiment premium”, which is for our analysis fully expected. Instead, it is the replication of the same pattern in so many places (as noted earlier today). |
Global Manufacturing PMI's, July 2014 - May 2017 - Click to enlarge |
| The most striking part of these correlations is not the downturn in their middle, but rather the near uniform peak early in 2017 at the right hand side of each. You can substitute whatever PMI you might like and achieve the same results: |
U.S. CPI Changes On Energy, July 2014 - April 2017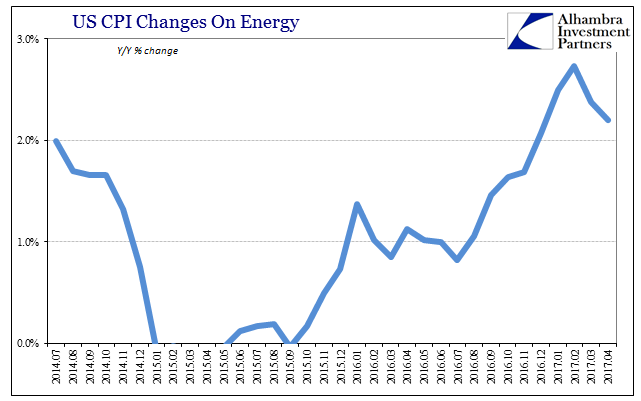 - Click to enlarge |
| Using something like JP Morgan’s Global Manufacturing PMI exhibits the same tendencies throughout, including those of more recent months, capturing a truly global outline. I don’t think this synchronization at all a mystery, as no more than oil prices do these relate to “dollar” conditions both as a matter of the short run (better in 2017 than 2016) as well as the longer-term (repeating 2014 rather than 2011). |
Global Manufacturing PMI's, July 2014 - May 2017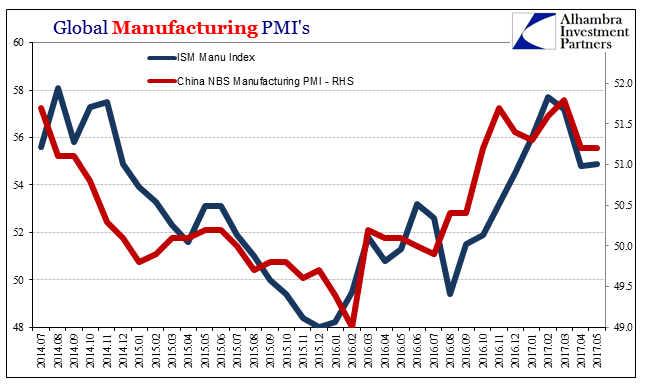 - Click to enlarge |
| Compared to “dollar” indications, however, economic sentiment is much further ahead than it is of economic hard data. That would suggest the appearance of cyclical forces, suppressed as they might be in historical comparisons. It does make for an interesting hierarchy that suggests a lot about perception of this condition; the “dollar” rebounds very little; the economy a little more; sentiment much more. |
Global Dollars And Sentiment, July 2014 - May 2017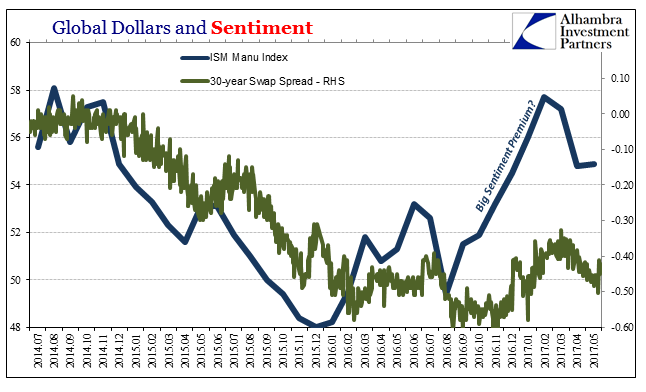 - Click to enlarge |
| As in 2014, the last one is making too much out of what are really minor changes overall. In more “dollar” terms like swap spreads, there isn’t much of any improvement in 2017, especially as compared to 2014.
The patterns are all the same as you would expect with the “rising dollar” driving everything, but the clear difference in intensity especially after the middle of 2016 is as a global issue. Oil is just the most prominent form of it, working through inflation measurements as well as directly in sentiment. People seem to be relieved about oil prices being up without realizing they aren’t actually up (not even technically anymore). In other words, “reflation” was signaled by the rebound in oil as if the rebound in oil meant the end of the “rising dollar”, which was further translated in some expectations (including consumer sentiment) an end to the persistent low growth state. If weakness is but transitory as the Fed kept declaring the past few years, then at its end should there not be the promised economic acceleration? It does seem as if the world was expecting that, and economists here and elsewhere are in no rush to clarify much downgraded expectations. By historical standards, then, there is a seemingly reasonable basis to believe this. But after more than five years in this secondary slowdown condition, and more than a decade into the unique and unknown, there should have been and be now more caution about applying what were once reasonable standards. The “dollar” overall doesn’t ever get better, it only at times stops getting worse. The economy after three episodes of crisis and “reflations” has clearly and globally taken on these proportions. Sentiment has yet to catch up, but oil prices may already be correcting it. |
Global Dollars And Sentiment, July 2014 - May 2017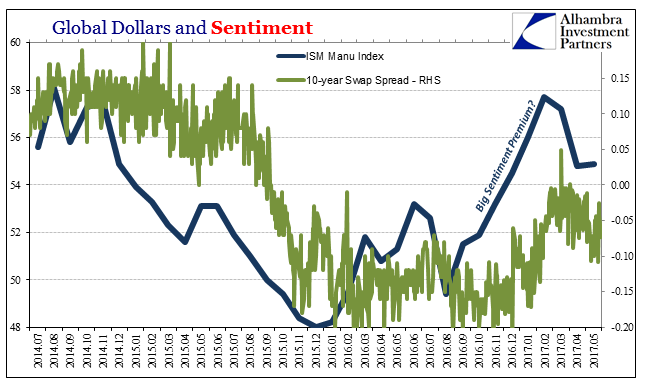 - Click to enlarge |
Full story here Are you the author?
Tags: caixin,China,Consumer Prices,currencies,depression,economy,EuroDollar,eurodollar system,Federal Reserve/Monetary Policy,IHS Markit,manufacturing,Markets,newslettersent,non-manufacturing,oil prices,PMI,swap spreads,U.S. ISM Manufacturing PMI