


Jeffrey P. Snider
My articles My offerMy siteAbout meMy videosMy books
Follow on:LinkedINTwitterSeeking Alpha
| The irony of the unemployment rate for the Federal Reserve is that the lower it gets now the bigger the problem it is for officials. It has been up to this year their sole source of economic comfort. Throughout 2015, the Establishment Survey improperly contributed much the same sympathy, but even it no longer resides on the plus side of the official ledger.
So many people may have exited the labor force in May that the unemployment rate dropped to just 4.3% even though headline payroll gains were once again lackluster. The last time the ratio was this low George W. Bush was just a year into his first term, no one had yet much idea of the housing bubble because at that moment in May 2001 of greater concern was the dot-com bubble and its related recession that had yet to be realized in effect. It was then the last hurrah of the nineties economy. It is very difficult to compare that 4.3% rate with this one, for the current regime looks nothing at all like that one even though for the past three years economists and policymakers have tried to make it stick. The current Fed estimates claim that “full employment” is almost certain to be at 4.3%, the modeled lower bound for its central tendency. We know what the FOMC will do for its June economic updates. They will move the goalposts yet again, forced to reduce their projections for what qualifies as long run labor potential because by next month the unemployment rate could be even less than the so-called lower bound. |
Unemployment Rate, January 2013 - May 2017(see more posts on U.S. Unemployment Rate, ) - Click to enlarge |
| But as we know all too well, and economists try all too hard to ignore, there is a vast difference in an unemployment rate where the labor force is at best static or barely rising and one where participation is as robust as headline payroll growth. A rate of 4.3% might be full employment in some other time, but not this one. Instead, the lower the unemployment rate goes now, the worse it is for policymakers clinging to it as if it was the same as it was sixteen years ago. |
Accounting For All Labor, December 2016 - Click to enlarge |
| The payroll report overall was a complete washout. There had been even into 2016 several monthly labor updates that were, as I called them, perfect – strong headline for the Establishment Survey, a month where the labor force expanded, and corroboration via the Household Survey. The statistics for May 2017 are all the opposite. Just as a single perfect month did not suggest all that much that was meaningful, a single month entirely disappointing would not, either. However, these “bad” months are becoming more frequent and are now noticeable in sequence for how they are no longer somewhat offset by any “perfect” reports anymore. The headline Establishment Survey gained just 138k last month, while the Household Survey that had been on a rise February and March declined by 233k. The labor force declined by a significant amount, down 429k just in May and for the five months in 2017 combined up just 144k. Since last September, when the unemployment rate last stood at 5%, the labor force is 46k less for those eight months (though that includes a discontinuity related to population revisions). |
Establishment Survey, January 2010 - May 2017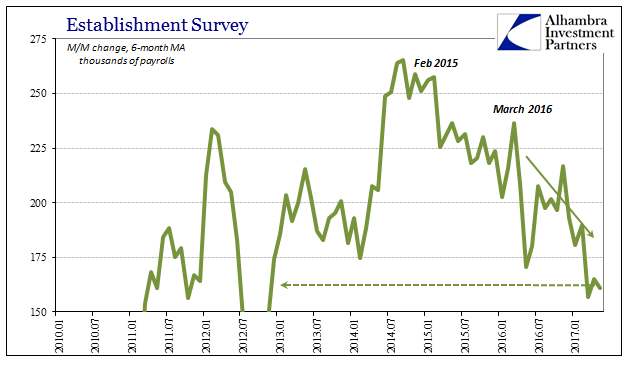 - Click to enlarge |
| The labor market is typically a lagging indication, but enough time has passed that there should have been by now actual signs of a turnaround from the downturn early last year. It would appear to have been more severe than that, though not in a recessionary, cyclical sort of way. As has been the case over especially the past six years, the economy gets weaker and then never really stops. In this latest episode, the “rising dollar” appears to have penetrated economic boundaries to a point that now captures the labor market in that condition (though it has arguably been this way for years, as the headline payroll acceleration particularly in the second half of 2014 looks more and more dubious in the same way as the unemployment rate the more time passes). |
Average Weekly Hours All Employees, August 2007 - May 2017(see more posts on average weekly hours, ) - Click to enlarge |
| As the denominator for the unemployment rate is once more at a standstill, the numerator has slowed, too. The average monthly gain for the Household Survey over those same eight months is a small 125k, and that includes two months (February and March) at more than +400k. The Establishment Survey has averaged 157k in that time, just 121k the last three months. If it wasn’t clear before, we can with these figues better appreciate why consumer spending and incomes were so weak where they were supposed to have been meaningfully improved.
It suggests quite convincingly that the labor market is still slowing and perhaps reaching concerning levels of uneven sluggishness again. Long gone are the statistical dreams of “the best jobs market in decades”, replaced by what is for economists a conundrum (they leave themselves so many). It was one year ago when the “unexpectedly” weak May 2016 payroll report was released, shocking many out of their Establishment Survey love affair. In that time, the trajectory has only been weaker still with as yet no turn upward despite 4.3% and an even fuller “full unemployment.” |
Average Weekly Hours All Employees, March 2006 - June 2017(see more posts on average weekly hours, )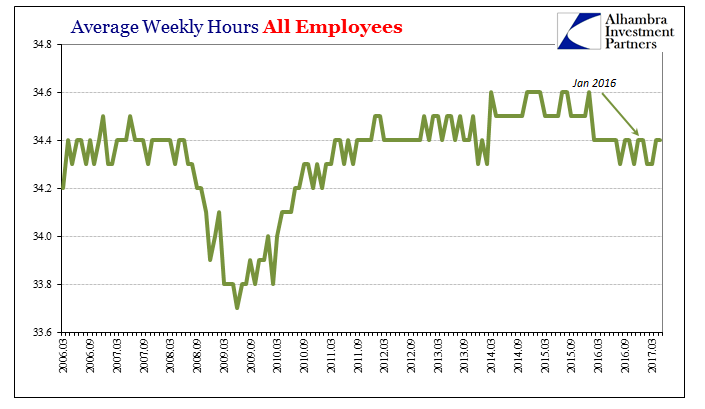 - Click to enlarge |
| The biggest cost to any economic system is time. What is further indicated here is exactly that cost, meaning that our biggest concern is not individual recession but rather being stuck in the same pattern of uneven growth that isn’t growth. Like GDP, the “good” payroll reports are proving to be the anomaly when by light of the unemployment rate the opposite should be true. With inflation falling the same as the labor force, how low must the unemployment rate go if enough people drop out before this contemptible and dangerous state is finally recognized for what it really is? The world has been left upside down, as contrary to all history the lower it goes the more it signals “something” is wrong.
Unfortunately for the Fed, there aren’t enough drug addicts to explain Japanese levels for the unemployment rate, only Japanification. |
Civilian Labor Force Participation Rate Versus Unemployment Rate, January 1995 - May 2017 - Click to enlarge |
Full story here Are you the author?
Tags: average weekly hours,bls,currencies,depression,economy,employment,establishment survey,Federal Reserve/Monetary Policy,household survey,inflation,Labor Market,Markets,newslettersent,payrolls,U.S. Unemployment Rate,unemployment rate


