Jeffrey P. Snider
My articles My offerMy siteAbout meMy videosMy books
Follow on:LinkedINTwitterSeeking Alpha
| China’s PMI’s were uniformly disappointing with respect to what Moody’s was on about last week. Chinese authorities expended great effort and resources to get the economy moving forward again after several years of “dollar”-driven deceleration. There was a massive “stimulus” spending program where State-owned FAI expenditures of about 2% of GDP were elicited to make up for Private FAI that at one point last year was actually contracting. In addition, the PBOC has pushed the limits of de-dollarizing China all in the attempt at rectifying monetary contraction that it thought handled (with traditional cuts) in 2015.
With that background, a sluggish improvement in 2017 over 2016 is actually no improvement at all. I know that I keep writing the same thing over and over (and over and over), but until it stops being true that’s all I can put down. With the cyclical nature of any upswing combined with so much “stimulus”, lackluster is truly disappointing especially more than a year past the most recent trough. I believe that more than anything was the driving message of Moody’s downgrade. |
China NBS Manufacturing PMI, May 2007 - May 2017(see more posts on China Manufacturing PMI, )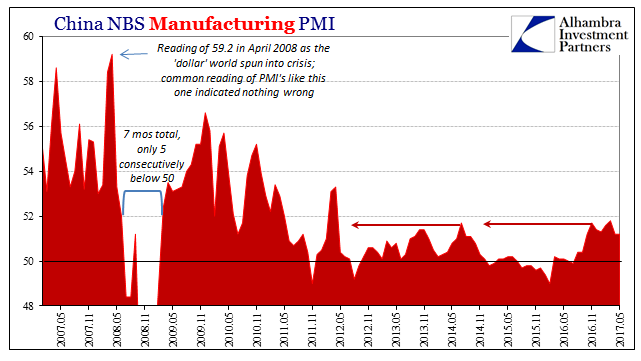 - Click to enlarge |
| The more time passes, the less it looks like there is any plausible pathway to regain 2011-type economic momentum let alone pre-crisis growth rates. That’s a problem for a country stuffed with credit, most of which was initiated on the premise that China’s “miracle” was only temporarily delayed by a Great “Recession”; a permanent state of low and uneven growth is an entirely more risky situation.
That is what the PMI’s are suggesting for May 2017, just as they have for years. Since 2012, the aftermath of the “dollar” events in 2011, there is only the intermittent exchange of signs; low growth gives way to shallow contraction and then back again. China’s “official” manufacturing PMI, the NBS version, seems to have up to now stalled out at the point right around where it did in 2014. Similarly, the non-manufacturing version has achieved a similar pattern, though at a lower point of comparison than in the recent past. |
China NBS Non-Manufacturing Business Index, May 2007 - May 2017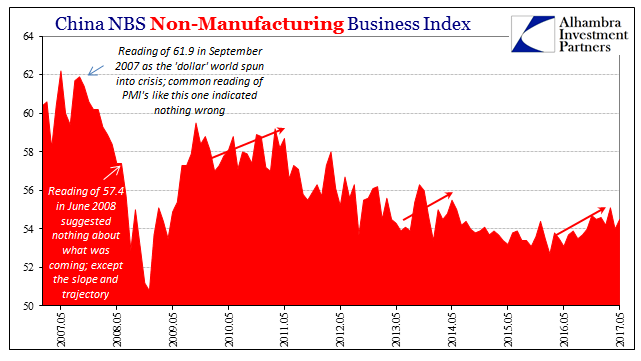 - Click to enlarge |
| Maybe it is just a temporary pause before unusually slow positive forces start to build back up again. It may be China’s third PMI, however, that suggests more so depletion of the too slow trend than pause. The Caixin Manufacturing Purchasing Managers Index fell below 50 in May for the first time since last June. What is significant is not that it is less than the so-called growth/contraction dividing line, but that its trajectory over the past few years is far too reminiscent of oil prices. |
China Caixin Manufaturers PMI, November 2015 - May 2017(see more posts on China Caixin Manufacturing PMI, )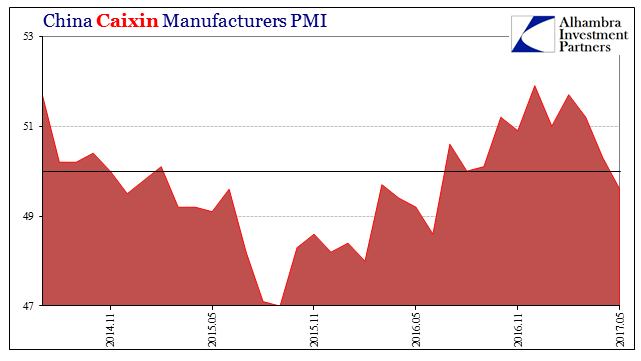 - Click to enlarge |
| It’s a little too close the US CPI not to notice. Since the consumer price index is captured by changes in oil prices, it is fair to conclude that there are perhaps very real effects to commodity price changes in the Chinese economy as well (as also can be seen via Chinese imports). That would further suggest the stall in the commodity rebound is as, if not more, significant than the rise from the trough. As has been the case repeatedly, sentiment has tended to get ahead of reality. With specifically oil, what’s meaningful is not that it is up from February 2016 but that for the past year it has gone no further, an economic as well as financial omen. |
U.S. CPI Changes On Energy, July 2014 - April 2017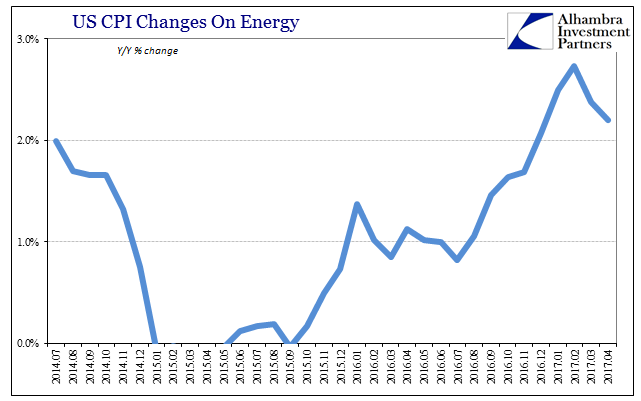 - Click to enlarge |
| We are conditioned to believe that once a downturn passes rapid growth takes over until the prior trend resumes. But if that prior trend was itself unusually low and uneven growth, by what standard should expect after the downturn passes? It seems clearer the further we go into 2017 that it isn’t historical expectations that are useful, only recent history. And that is entirely the problem, as the Moody’s downgrade helpfully suggests in the obvious.. |
China Imports, July 2014 - April 2017(see more posts on China Imports, )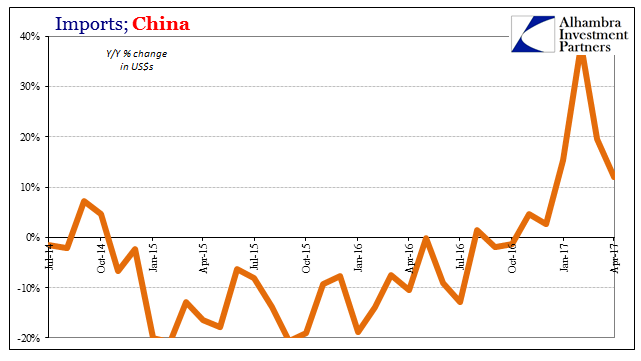 - Click to enlarge |
| It doesn’t look like China is improving itself back to health, but as everywhere else at the current moment just not deteriorating further. Simply being back on the plus side of 50 doesn’t mean what it is always taken to mean. |
WTI Oil Prices, February 2016 - June 2017 - Click to enlarge |
Full story here Are you the author?
Tags: caixin,China,China Caixin Manufacturing PMI,China Imports,China Manufacturing PMI,Consumer Prices,currencies,depression,economy,Federal Reserve/Monetary Policy,manufacturing,Markets,newslettersent,non-manufacturing,oil prices,PMI