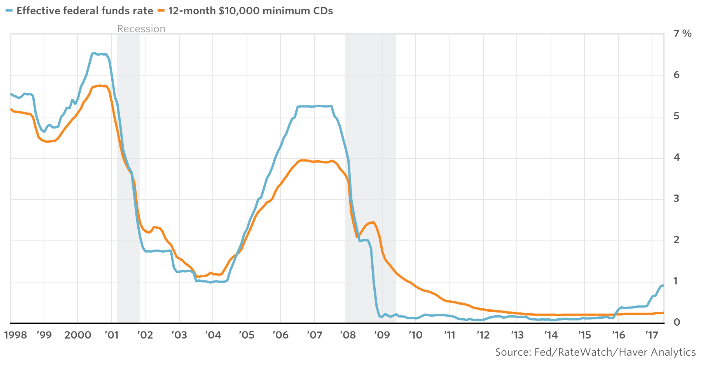
| This Great Graphic was posted by Steve Goldstein at MarketWatch. The blue line shows the effective Fed funds rate. The orange line depicts the average interest rate on a $10,000 one-year CD.
The Fed funds target rate has risen, but the rate of the average yield of the certificate of deposit has not risen. It is at 25 bp, an increase of five basis points over the past four years. Goldstein documents other evidence that the pass-through of tighter Fed policy has been limited. The FDIC reports that the national aver for non-jumbo savings accounts (less than $100k) was six basis points in May, and four basis points on interest-bearing checking accounts. A five-year CD gets about 80 bp. Goldstein points to the implication of the limited pass-through is on bank profitability. US bank profits were $44 bln in Q1 17. Owing a large part to net interest income, profits rose 12.7% from Q1 16. The FDIC reports that only 4.1% of US banks were not profitable. In effect, the bank could take the $10,000 for the CD and bring the money to the Federal Reserve. The Fed pays interest on all bank reserves. The interest rate is set at the top end of the Fed funds range. Currently, it is paying 1.0%, and assuming a rate hike later today; it will be paying 1.25% starting tomorrow. During the financial crisis, as banks scrambled to repair their balance sheets, they paid up for securing funding, as in CDs. The chart illustrates the variable lag and lead times of monetary policy how it passes from the banks to the broader economy. This is only part of the process. The limited or slow pass through effects the behavior of savers. There has been strong retail demand for US fixed income funds. It appears that households are taking part of their savings and using a bond fund as an alternative to cash. This may be helping to keep US interest rates low and financial conditions looser.
|
Federal Funds Rate And Average Interest Rate, May 2017(see more posts on Federal Funds Rate, ) |
Tags: Federal Funds Rate,Great Graphic,newslettersent


