Jeffrey P. Snider
My articles My offerMy siteAbout meMy videosMy books
Follow on:LinkedINTwitterSeeking Alpha
| US imports rose 9% year-over-year (NSA) in March 2017, after being flat in February and up 12% in January. For the quarter overall, imports rose 7.3%, a rate that is slightly more than the 2013-14 comparison. The difference, however, is simply the price of oil. Removing petroleum, imports rose instead 6.3% in March and just 4% for the first quarter overall. The value of inbound crude oil expanded by more than 70% for the second straight month. |
US Imports, June 1989 - May 2017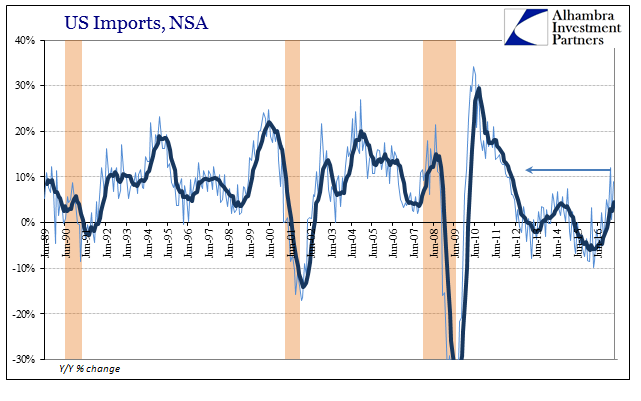 - Click to enlarge |
| Seasonal adjustments were not at all impressed by these growth rates, however, indicating potentially the loss of what little momentum for improvement there has been. T |
US Imports, June 2007 - May 2017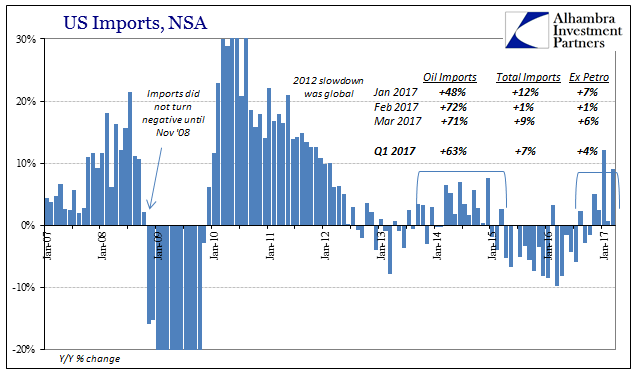 - Click to enlarge |
| Total imports were down for the second straight month, as were those factoring out crude oil. |
US Imports, June 1989 - May 2017 - Click to enlarge |
| It hasn’t been unusual for trade activity even in the adjusted series to decline in late winter, so it remains to be seen just how significant this might be. |
US Imports Petroleum, June 1989 - May 2017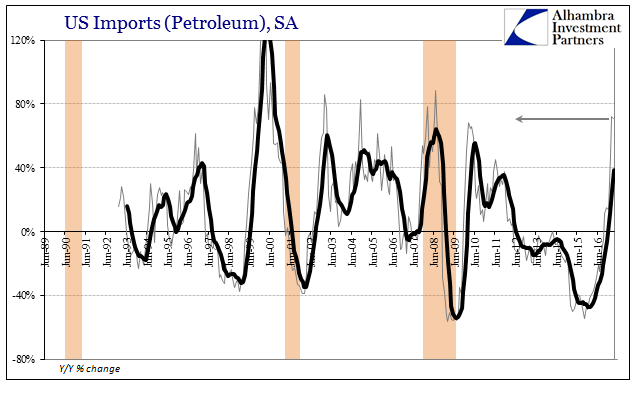 - Click to enlarge |
| hat plus the fading effects of oil prices will in the coming months give us a better idea how much of an upgrade in US “demand” there may really be. |
US Imports Ex Petroleum, January 2007 - May 2017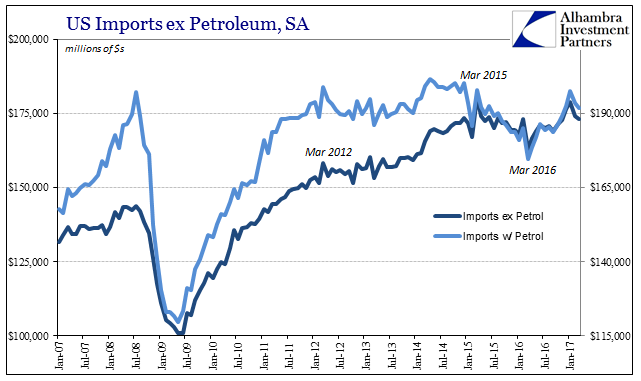 - Click to enlarge |
| Imports from China were up 14.6% in March, following a 9.4% decline in February. Calendar effects as always make monthly comparisons difficult, so the total for the quarter as a whole is likely much more reflective of actual conditions. Total trade from China for the three months together was 5% more than that in the first three months of 2016. It is clearly better when compared to last year when the US imported 7.3% less from the Chinese, but it was nowhere near the 11% gain in Q1 the year before (2015) which came during the start of this “rising dollar” related “global turmoil.” |
US Imports From China, June 1989 - May 2017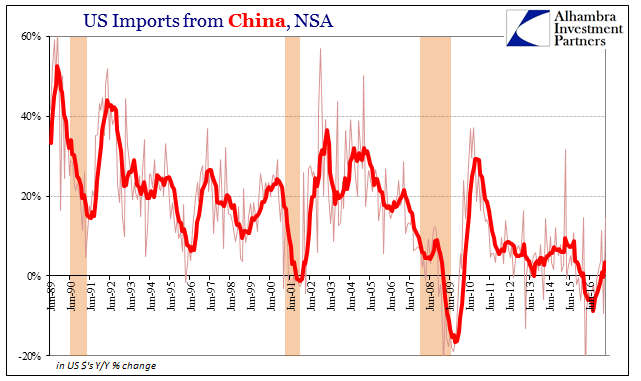 - Click to enlarge |
| Echoing the lack of visible acceleration, and perhaps more concerning, US imports from Europe actually fell in March. The euro has strengthened somewhat during the last three months, but not so much as to suggest a serious drag on trade across the Atlantic. For the quarter as a whole, imports from the EU were up just 2.7% from Q1 2016. |
US Imports From European Union, June 1989 - May 2017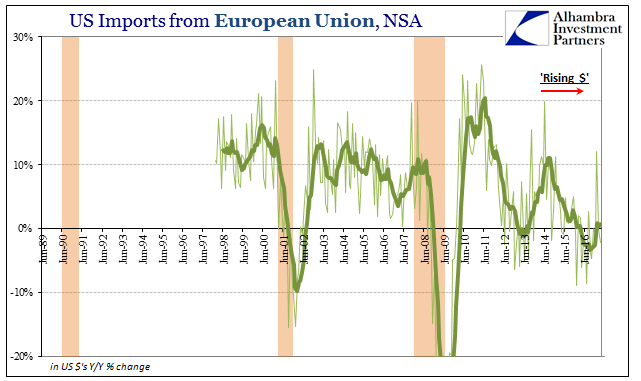 - Click to enlarge |
| This subdued rate of expansion in US demand after several tough but shallow years of contraction is consistently found across a range of economic accounts. US Factory Orders, for example, were up 6.2% year-over-year also in March, the best growth rate in nearly three years for that indication. |
Factory Orders For All Manufacturing Industries, February 1992 - May 2017 - Click to enlarge |
| But like imports, rather than suggest a change in economic circumstance related to US consumers it merely implies instead the repeating “cycle” of low-grade variability. |
Factory Orders For All Manufacturing Industries, February 1992 - May 2017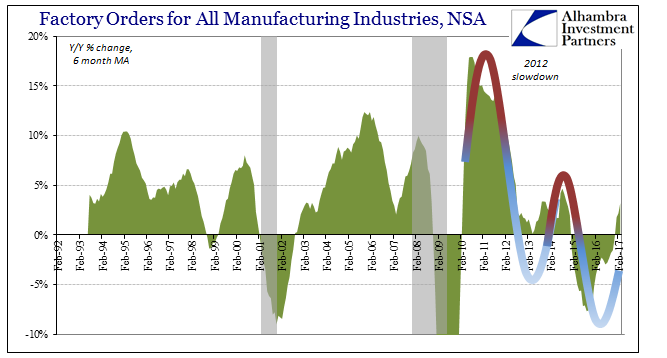 - Click to enlarge |
| At least for the export side of US trade, there is a relatively more robust rebound, though still comparatively short by historical standards. If sentiment is high in US manufacturing, it is very likely more so due to outbound trade than domestic demand for goods. Exports rose 8.1% in March year-over-year (NSA) and were up 7.3% for the quarter, with no oversized crude component to pull that number back toward disappointing reality. But like the import figures, the seasonal adjustments did not register the same kind of gains. |
US Trade, January 2014 - January 2017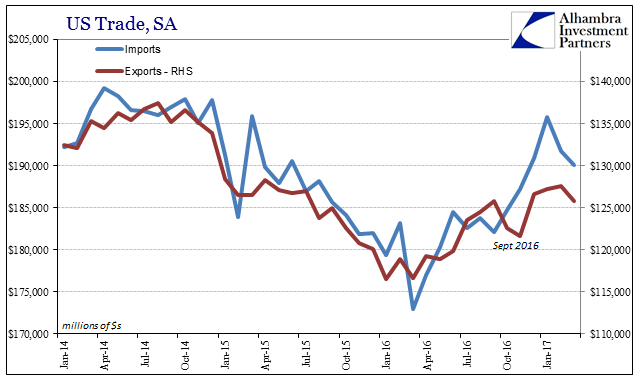 - Click to enlarge |
| Instead, exports remain significantly less than the trajectory of three years ago when this latest “dollar” interruption started, all of which accomplishes the same sort of thing, meaning that the US and global economy has improved but somehow it remains debatable by how much. At this point, especially with the third anniversary of that event almost at hand, it really should not be this way. Had the economy fully healed, which in this case means breaking out to an entirely different baseline of actual growth, the rapid ascent would be less contentious, less dependent on oil prices, and generally free of being able to easily apply the word lackluster. |
US Exports, June 1989 - May 2017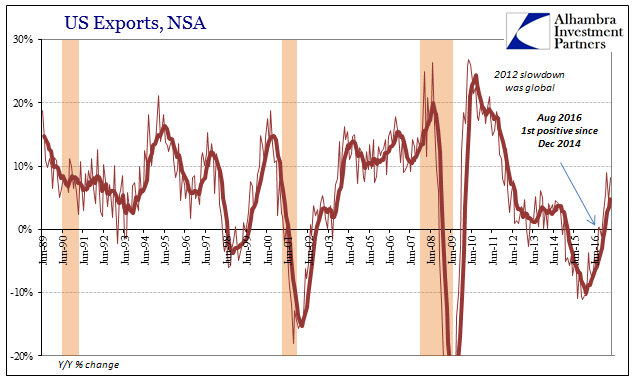 - Click to enlarge |
Full story here Are you the author?
Jeffrey P. Snider is the head of Global Investment Research of Alhambra Investment Partners (AIP). Jeffrey was 12 years at Atlantic Capital Management where he anticipated the financial crisis with critical research. His company is a global investment adviser, hence potential Swiss clients should not hesitate to contact AIP
Tags: China,consumers,currencies,demand,depression,dollar,economy,Europe,exports,factory orders,Federal Reserve/Monetary Policy,global trade,imports,manufacturing,Markets,newslettersent