Jeffrey P. Snider
My articles My offerMy siteAbout meMy videosMy books
Follow on:LinkedINTwitterSeeking Alpha
| China’s trade statistics for April 2017 uniformly disappointed. They only did so, however, because expectations are being calibrated as if the current economy is actually different. It is instead merely swinging between bouts of contraction and low-grade growth, but so low-grade it really doesn’t qualify as growth. Positive numbers do get the mind racing, but since the end of 2011 there is almost a speed limit on how fast the global economy can go on these relative upswings.
To this point, Chinese exports have performed as if that was the case. Exports were expanded by 8% in April 2017, which sounds like an impressive feat though only given the circumstances of the past few years. In truth, the dollar amount of China’s outbound trade last month was 1% less than in April 2014, and still just slightly below the level of April 2013. |
China Exports, January 2008 - April 2017(see more posts on China Exports, )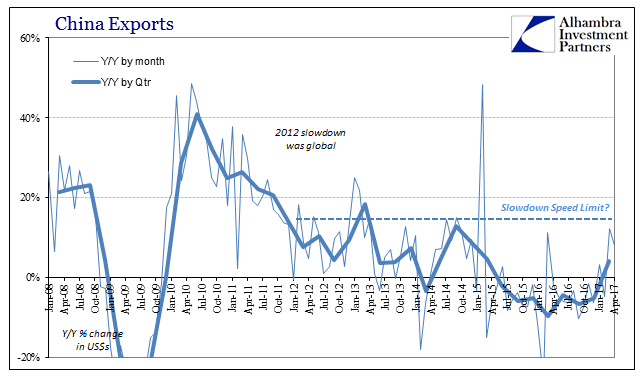 - Click to enlarge |
| Though exports were up 12% in March, both of the past two months are less buoyant than during the 2013-14 period. That may change over the coming months, but the lack of momentum indicated all over the world renders that a much lower probability prospect.
The import side perhaps best demonstrates the conspicuous absence of acceleration. To claim 38% growth is underwhelming might at first appear to be due to nothing less than bias. That was the rate of growth for Chinese imports in February, followed in March by 20% expansion. The rate in April, however, was but 11.9%, so you can see where this is going. Like oil prices, commodity prices in general have forced these base effects to be displayed all over economic accounts, including China’s import levels which are heavily influenced by these price changes given that much of what the country brings in is raw material. |
China Imports, January 2008 - April 2017(see more posts on China Imports, )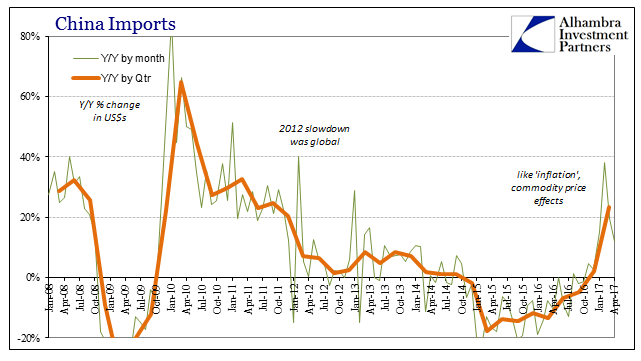 - Click to enlarge |
| Without a solid and sustained further increase in those prices, Chinese imports are scheduled to, like Western inflation rates, revisit disappointing levels in the near future (if not already for April).
Therefore, what we find on the import side is only price momentum absent the full-blown recovery scope that includes far more than base effect comparisons to trough levels one year prior (especially February). At the end of the Great “Recession” or even the dot-com recession, China’s imports exploded higher with both prices as well as economy behind them. From a low point in March 2002, by March 2003 the 6-month average of inbound trade growth was 42.9%; from a low in May 2009, by May 2010 the 6-month average was almost 60%. |
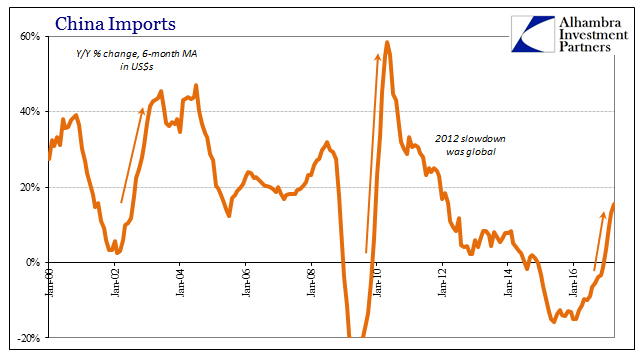 |
| Unless imports into China start to seriously accelerate as soon as this month, it appears as if this “recovery” in 2017 will top out at around 15%, with a single month high point of just 38%. Prices but nothing else.
It does seem as if this continued deficiency is dawning on proponents of “reflation.” Commodity prices have declined, including copper breaking down below $2.50 for the first time since the beginning of this year. Chinese money markets are a total mess, which the mainstream obediently attributes to PBOC policy rather than global “tight” “dollar” conditions and the economic consequences of them (which would explain the trade statistics and their “speed limit”). |
China Copper Futures Price, September 2015 - May 2017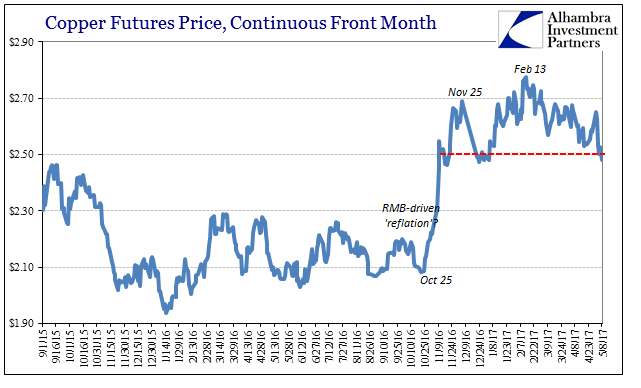 - Click to enlarge |
| What will likely be most devastating to “reflation” is the ultimate realization that it was not all the things the current trend envisioned as holding the global economy back. By that I mean the US tax code didn’t cause Europe’s re-recession in 2012, just as Obamacare did not put the brakes on Chinese expansion, particularly via trade, at the exact same time. Therefore, actually fixing the global economy will require actually addressing what is truly wrong with it. |
Shanghai Interbank Offered Rate, January 2016 - May 2017(see more posts on shibor, ) - Click to enlarge |
One final note: as discussed one month ago in April, China’s trade had by that time been exhibiting considerable discrepancies among reporting agencies.
|
Shanghai Interbank Offered Rate Time Premiums, August 2016 - May 2017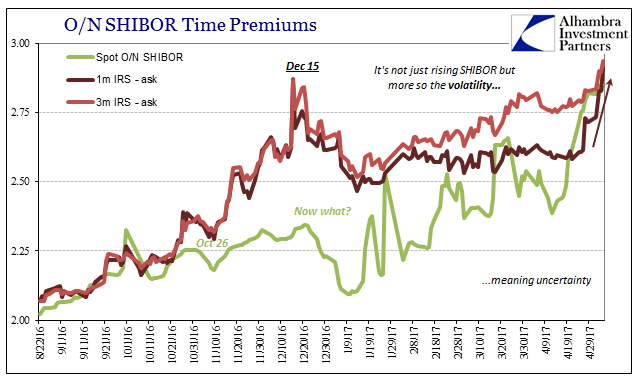 - Click to enlarge |
| Without any explanation, the numbers again appear to match for April as well as March (2017). We may not treat these estimates for what they really are (sometimes barely more than educated guesses; trend-cycle being one such pathway to introduce raw speculation), but these government agencies do themselves no favors by always seeming to produce the biggest divergences at the most opportune moments (like BLS figures in 2014) and in the most charitable direction.
It fuels conspiracy when a more a productive criticism would be to directly address any shortcomings in either data gathering or more likely the underlying philosophy for creating these numbers (like trend-cycle). Whatever ultimately may have been the cause, during the height of the latest “reflation” China’s export figures appeared to have been more robust than they were (at least as of this moment according to the NBS) at a moment Chinese officials were invested in showing stability (particularly CNY). In other words, absolutely nothing has changed. |
China Exports, October 1998 - May 2017(see more posts on China Exports, )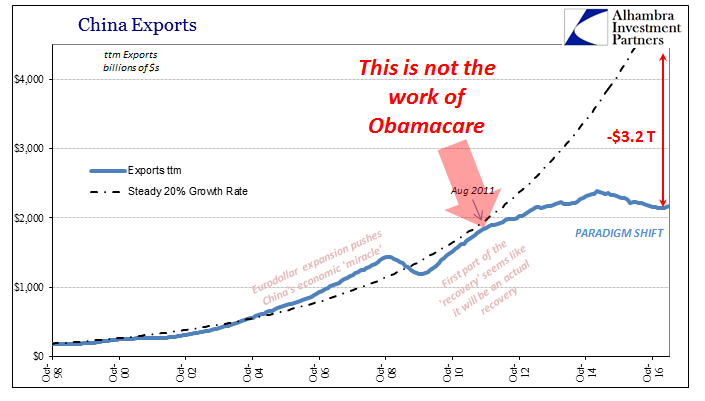 - Click to enlarge |
Tags: China,China Exports,China Imports,currencies,depression,dollar,economy,EuroDollar,exports,Federal Reserve/Monetary Policy,global trade,imports,Markets,newslettersent,shibor,statistics,Trade,Trade Balance