| Two weeks ago Bank of America caused a stir when it calculated that central banks (mostly the ECB & BoJ) have bought $1 trillion of financial assets just in the first four months of 2017, which amounts to $3.6 trillion annualized, “the largest CB buying on record.” |
Aggregate Balance Sheet Of Large Central Banks, 2000 - 2017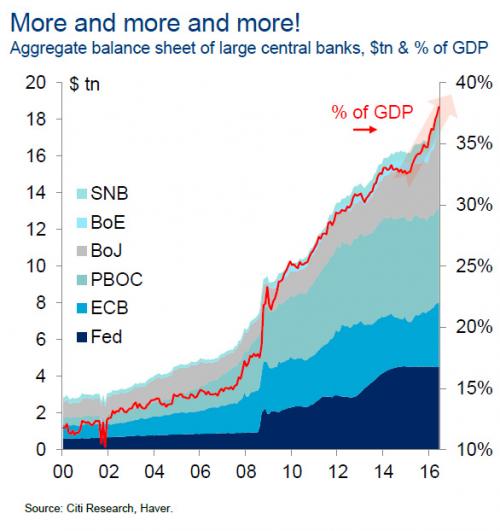 - Click to enlarge |
| BofA’s Michael Hartnett noted that supersized central bank intervention which he dubbed a “liquidity supernova” is “the best explanation why global stocks & bonds both annualizing double-digit gains YTD despite Trump, Le Pen, China, macro…” |
Central Bank Balance Sheet, 2006 - 2017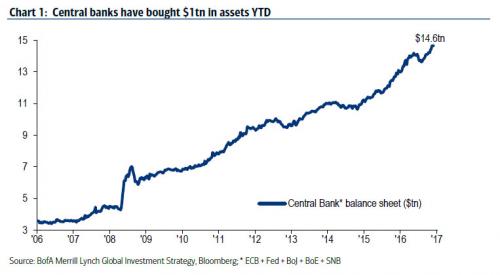 - Click to enlarge |
To be sure, Hartnett’s “discovery” did not come as a surprise to regular readers: back in October 2014, Citi’s Matt King calculated that it costs central banks $200 billion per quarter to avoid a market crash, or as he put it:
|
Net Liquidity Infection To Markets, 2009 - 2017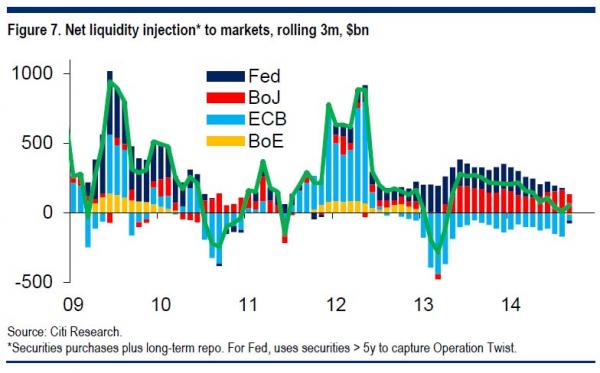 - Click to enlarge |
| Today we showed just what central bank buying looks like in practical terms when we demonstrated that the Swiss national Bank had purchased a record $17 billion in US equities in just the first quarter, bringing its total US equity long holdings to an all time high above $80 billion… |
Value Of Swiss National Bank US Stock Holdings, June 2014 - March 2017(see more posts on SNB US Stock Holdings, ) - Click to enlarge |
| … in the process soaking up nearly 4 million AAPL shares in the first 3 months of the year.
On the surface, these sums appear vast; however in the latest weekly report by Deutsche’s Dominic Konstam, the credit strategist finds something even more troubling: $1 trillion in central bank liquidity YTD – or roughly $250 billion per month – is not enough |
Swiss National Bank AAPL Holdings, Q2 0 2014 - Q1 2017(see more posts on SNB Holdings, ) - Click to enlarge |
| The reason is two-fold: on one hand there is the stock of existing central bank assets that keeps growing at an exponential pace, which implies that central banks have to monetize ever more assets just to keep the system from becoming unstable, or “running to stand still” as Citi recently framed the growing problem; on the other hand, offsetting the “organic” expansion of central bank balance sheets is the decline in FX reserves among liquidity managers, the most famous recent episode of which is China’s $1+ trillion drop in reserves which started in mid-2014 and has yet to conclude. Recall that global liquidity is defined in dollar terms “as the sum of all FX reserves, the fed’s balance sheet and the central bank balance sheets of the Eurozone, Japan, UK, China, India, Russia, Saudi, South Africa and Brazil.”
So what happens when in addition to central bank liquidity one adds various other global liquidity components? Here is Konstam’s troubling discovery:
Worse, the Deutsche Banker forecasts that “the weak patch for global liquidity growth is likely to extend through to 2017q4 where even based on flat FX reserves ahead of ECB or Fed balance sheet changes, the current rate of ex Fed central bank liquidity growth should lift liquidity growth back to slightly over 5 percent year over year.” This is a problem because “5 percent is not a lot at a global level. It doesn’t accommodate faster nominal growth. And as the chart below indicates is consistent with relatively subdued bond yields. In 5y5y US Treasury terms a 3 percent rate seems a little elevated as is and is pretty much discounting liquidity growth closer to 10 percent, a level last seen in 2013.” But the biggest disconnect between liquidity and implied “fair value” is once again to be found in stocks:
|
Global Liquidity, 2006 - 2018 - Click to enlarge |
| Why did Konstam make this analysis? Because, as he writes in his intro, “more than ever before in this tightening cycle we would suggest that the Fed faces the most delicate of balancing acts. There seems to be an almost automatic convergence on a June tightening with September also a possibility and then some kind of balance sheet adjustment. The ECB is widely viewed to be not far behind in terms of another taper and the possibility of an eventual depo rate increase (we think 15 bps priced by August 2018) as a quid pro quo for QE extension.”
In other words, just like Hans Lorenzen from Citi warning one week ago, the market is blissfully ignorant of the threat that imminent global central bank tightening poses on risk assets, a risk neither ETFs, nor algos, nor CTA have considered. Konstam’s conclusion is that there are two outcomes: either asset prices drops, or central banks will ultimately be forced to inject even more liquidity. Here is his take on the former:
|
Cost - Benefit Of Quantitative Easing - Click to enlarge |
And then the latter, which can be resolved by either QE4 (or more) or a sharp drop in the USD.
The bottom line, however, boils down to the following chart first shown by Citi last September, demonstrating that the marginal cost of central bank liquidity injection is now negative… … and is located in the lower right quadrant, something both markets and policy makers realize. Which means that when stocks realize just how insufficient the record $1 trillion in central bank liquidity has become, central banks – which have stepped into every single market correction over the past 7 years with some “liquidity supernova” – will, for the first time since the financial crisis – be out of tools… something Janet Yellen appears to have realized some time ago. |
 - Click to enlarge |
Tags: Bank,Bank of America,Banking,Bond,Brazil,Business,central banks,China,Copper,Economics,economy,European central bank,Eurozone,Finance,Financial crisis of 2007–2008,Financial markets,France,Great Recession,India,Janet Yellen,Japan,Market Crash,money,newslettersent,OECD,recovery,SNB Holdings,SNB US Stock Holdings,Swiss National Bank,Systemic risk,U.S. Treasury,US Federal Reserve