The economic reports since the last economic update were generally less than expected and disappointing. The weak growth of the last few years had been supported by autos and housing while energy has been a wildcard. When oil prices fell, starting in mid-2014 and bottoming in early 2016, economic growth suffered as the shale industry retrenched. I said during that entire time that while the problems in the energy industry would cause a slowdown, I had no idea if it would be sufficient to cause a recession. We have the answer to that now that oil is back to $46 and it is obviously no. But the energy industry may now be creating the conditions to test that theory again.
So, the three legged stool of energy, housing and autos was stable enough to stand on two legs and keep a + sign in front of the GDP figure. We may be about to find out if one leg is sufficient. One of the best reports of the last two weeks was the one on new home sales, up to a new high for the cycle at 621K. That is about the mid-point of the historical range – if you take out the nutty stuff from about 1997 to 2006 – and up over 15% from last year’s pace. Construction spending as a whole is back to its previous 2006 peak (actually a little higher) although last month’s figure was down a small amount from the previous month. Housing is, by far, the best part of the economy.
Auto sales, on the other hand, are working on several months of disappointing results and inventories are still high. While auto sales did move up slightly from last month, the 16.9M annual rate of sales is a long way from the over 18M rate posted in December. The year over year change is now negative. I would note that in previous cycles sales have tended to plateau and then trend sideways for quite a while before recession. So we could see sales just start to oscillate around 17M until recession arrives. Of course, growth was quite a bit stronger in those previous cycles so that might not work this time around. Suffice it to say that for now auto sales are no longer adding to growth.
Energy may also be facing some renewed weakness as crude prices appear to have peaked at least for now. Prices have fallen from $53 in mid-April to about $46 recently. The supply/demand situation appears to favor lower prices with inventories near all time highs and demand waning even as we enter the seasonally strong period for gasoline demand. US shale companies continue to ramp up production with rig counts rising relentlessly. OPEC seems powerless to affect the price trend. Will falling prices affect the market and economy as much as 2014/15? Like that period I’m going to say I don’t know. But I have heard and read that shale breakeven prices have been falling and that prices in the $30s won’t be a problem so maybe lower prices won’t affect the economy and markets as much as the last downtrend. That also means though that the low end of the potential price range may have to be lower this time to rein in production.
Those weak auto sales actually reflect two trends – weak manufacturing and weak consumption. The reports on manufacturing since the last update were generally disappointing as the slowdown continues. Durable Goods and Factory orders were both less than expected while ex-transportation numbers were even worse – in other words it isn’t just autos. The regional Fed surveys were a mixed bag but generally coming off their recent highs. The ISM manufacturing survey was also less than expected. Personal Income was less than expected which may have produced the weak consumption figures in the same report. Weak consumption and still relatively high inventories is not a recipe for renewed production.
The GDP report showed growth falling in the first quarter to just 0.7%. That was immediately dismissed as an anomaly as weak Q1 growth now is expected after three years of the same. There are lots of explanations floating around about the cause but as always I tend toward Occam’s Razor. Q1 has been weak the last few years because the expectation of a rebound in Q4 each year has proven false. Is it really surprising to the point of having to invent excuses for the weak Q1 that inventory built up but not sold in Q4 has to be worked off in Q1? The last two years have seen a rebound in growth in Q2 and Q3 – building up for the expected boom in Christmas sales that hasn’t come yet – so the same is expected this year.
| I suppose we’ll see soon enough but Q2 isn’t off to a very good start based on the data that’s been hitting the tape the last month. There was also quite a bit of optimism about investment in the GDP report but a large part of that was due to the ramp up in oil well drilling. If oil prices really do get going on the downside, that probably won’t be repeated. And other types of investment don’t look that robust.
Our market based indicators were more mixed than the economic reports. Not that there was really all that much change. While the course of the yield curve appears to be toward more flattening, the trend took a breather the last two weeks. The 10/2 curve flattened by all of 1 basis point since the last update: |
10- Year Treasury Constant Maturity 1996-2017(see more posts on U.S. Treasuries, ) |
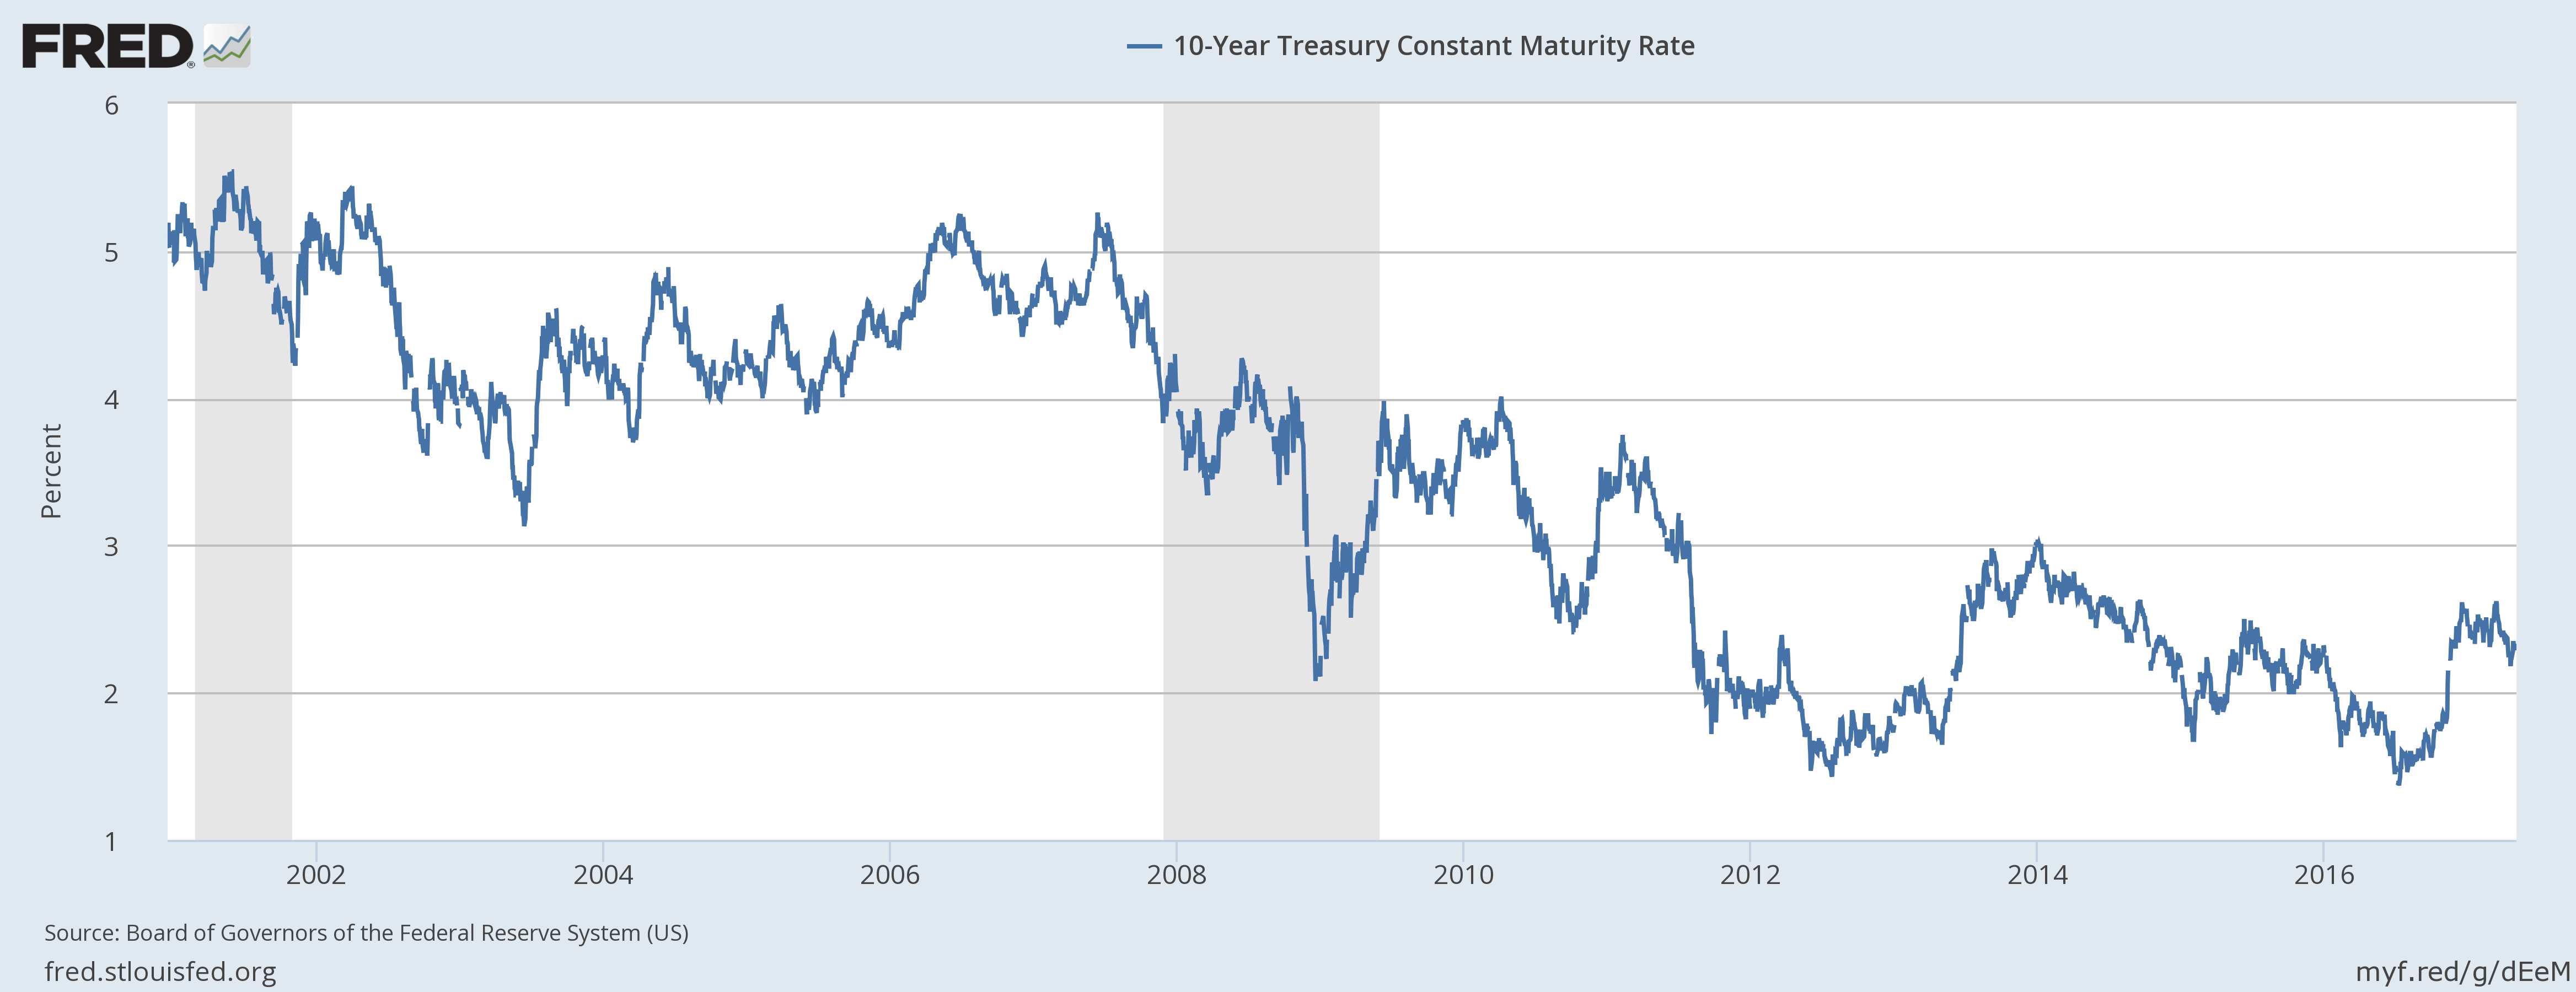
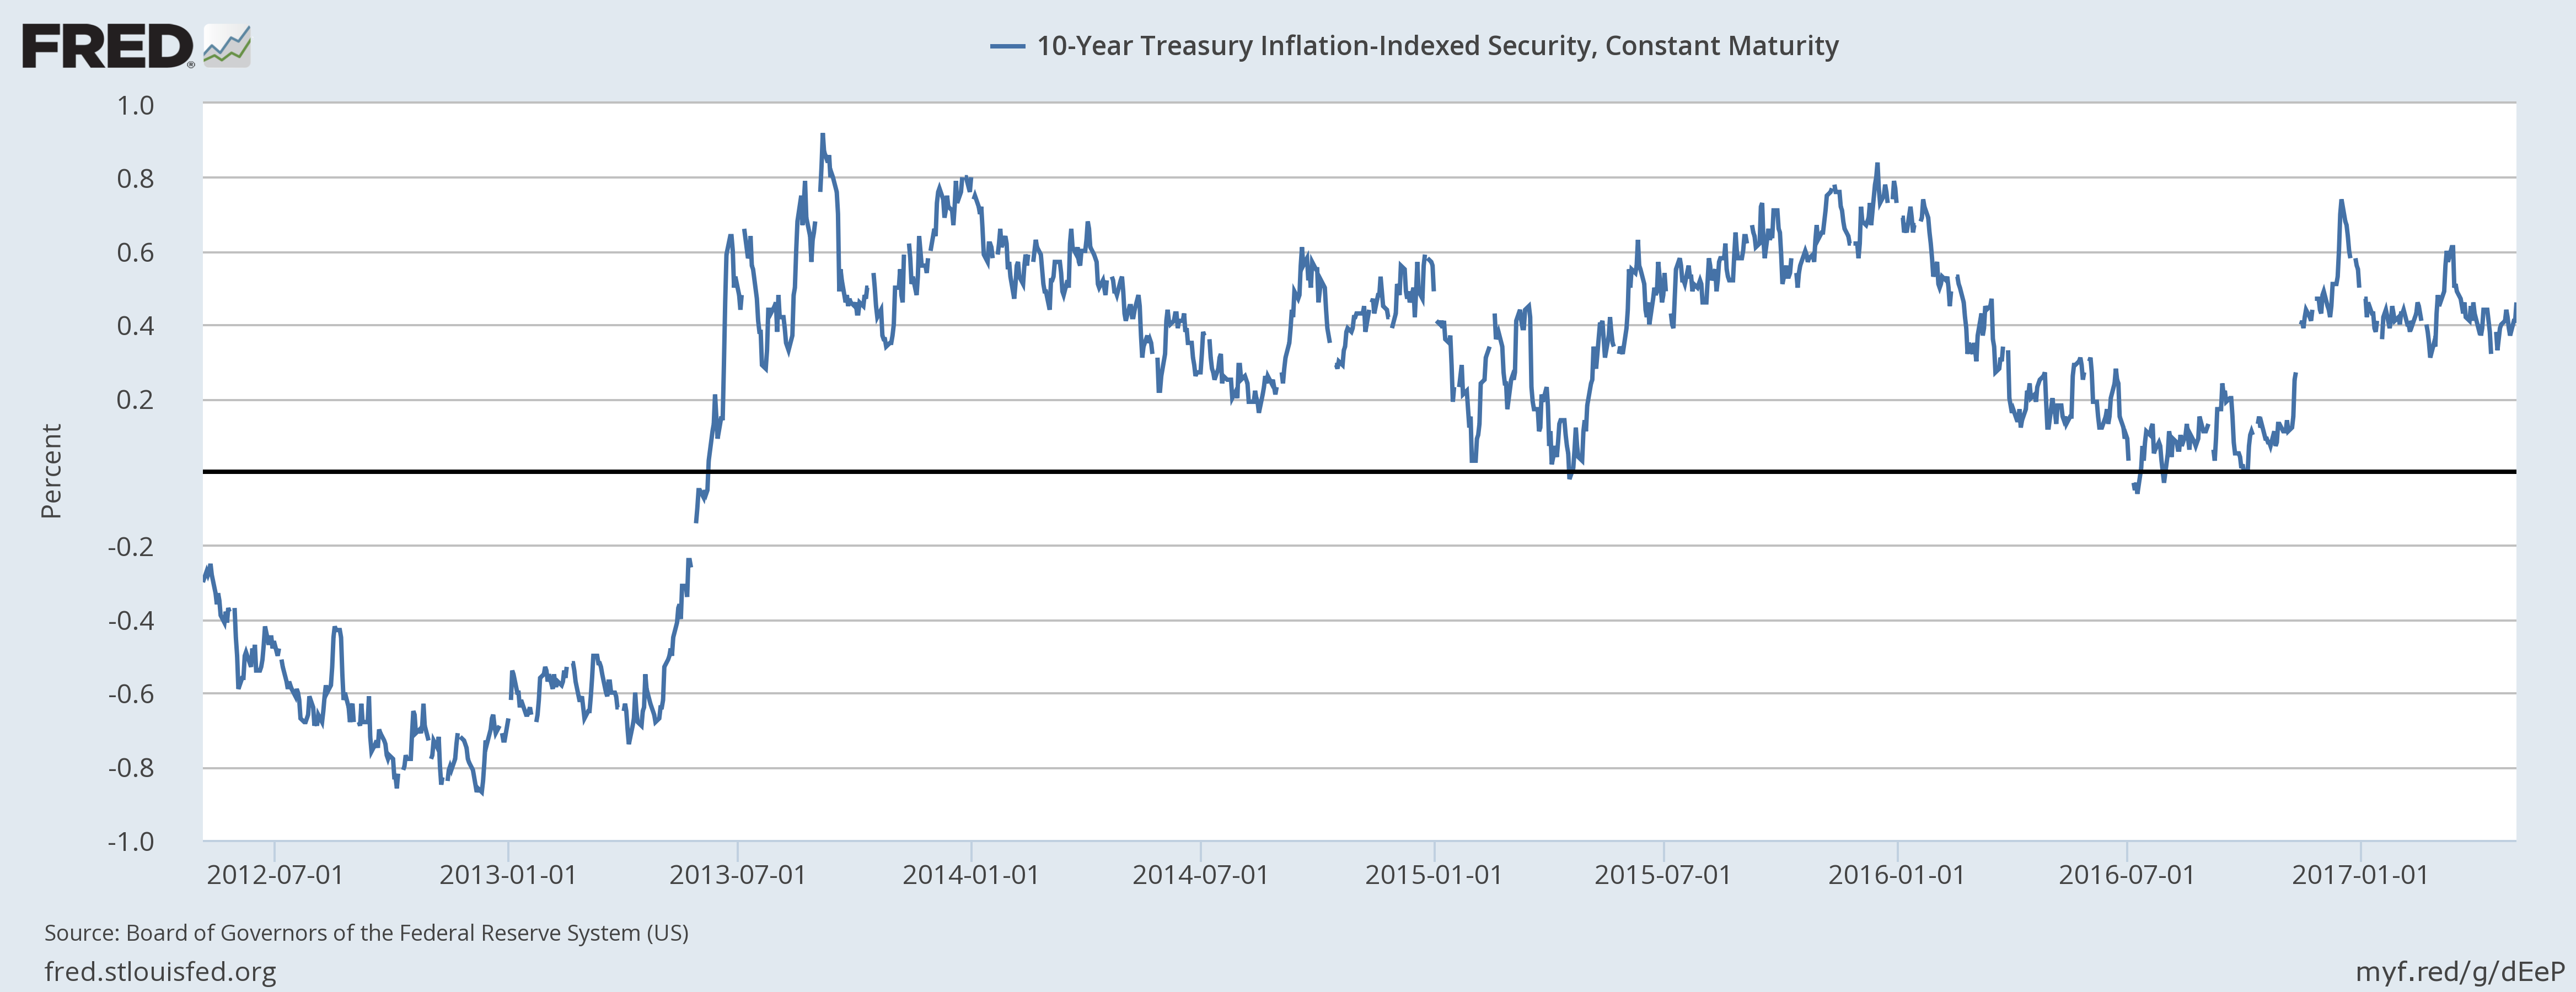
| Nominal and real bond yields were both up but the word nominal applies to both. The 10 year Treasury yield was up 9 basis points while the 10 year TIPs yield rose 6. |
10-Year Treasury Constant Maturity Rate from 2002(see more posts on U.S. Treasuries, ) |
10-Year Treasury Inflation-Indexed Security from 2002 |
|
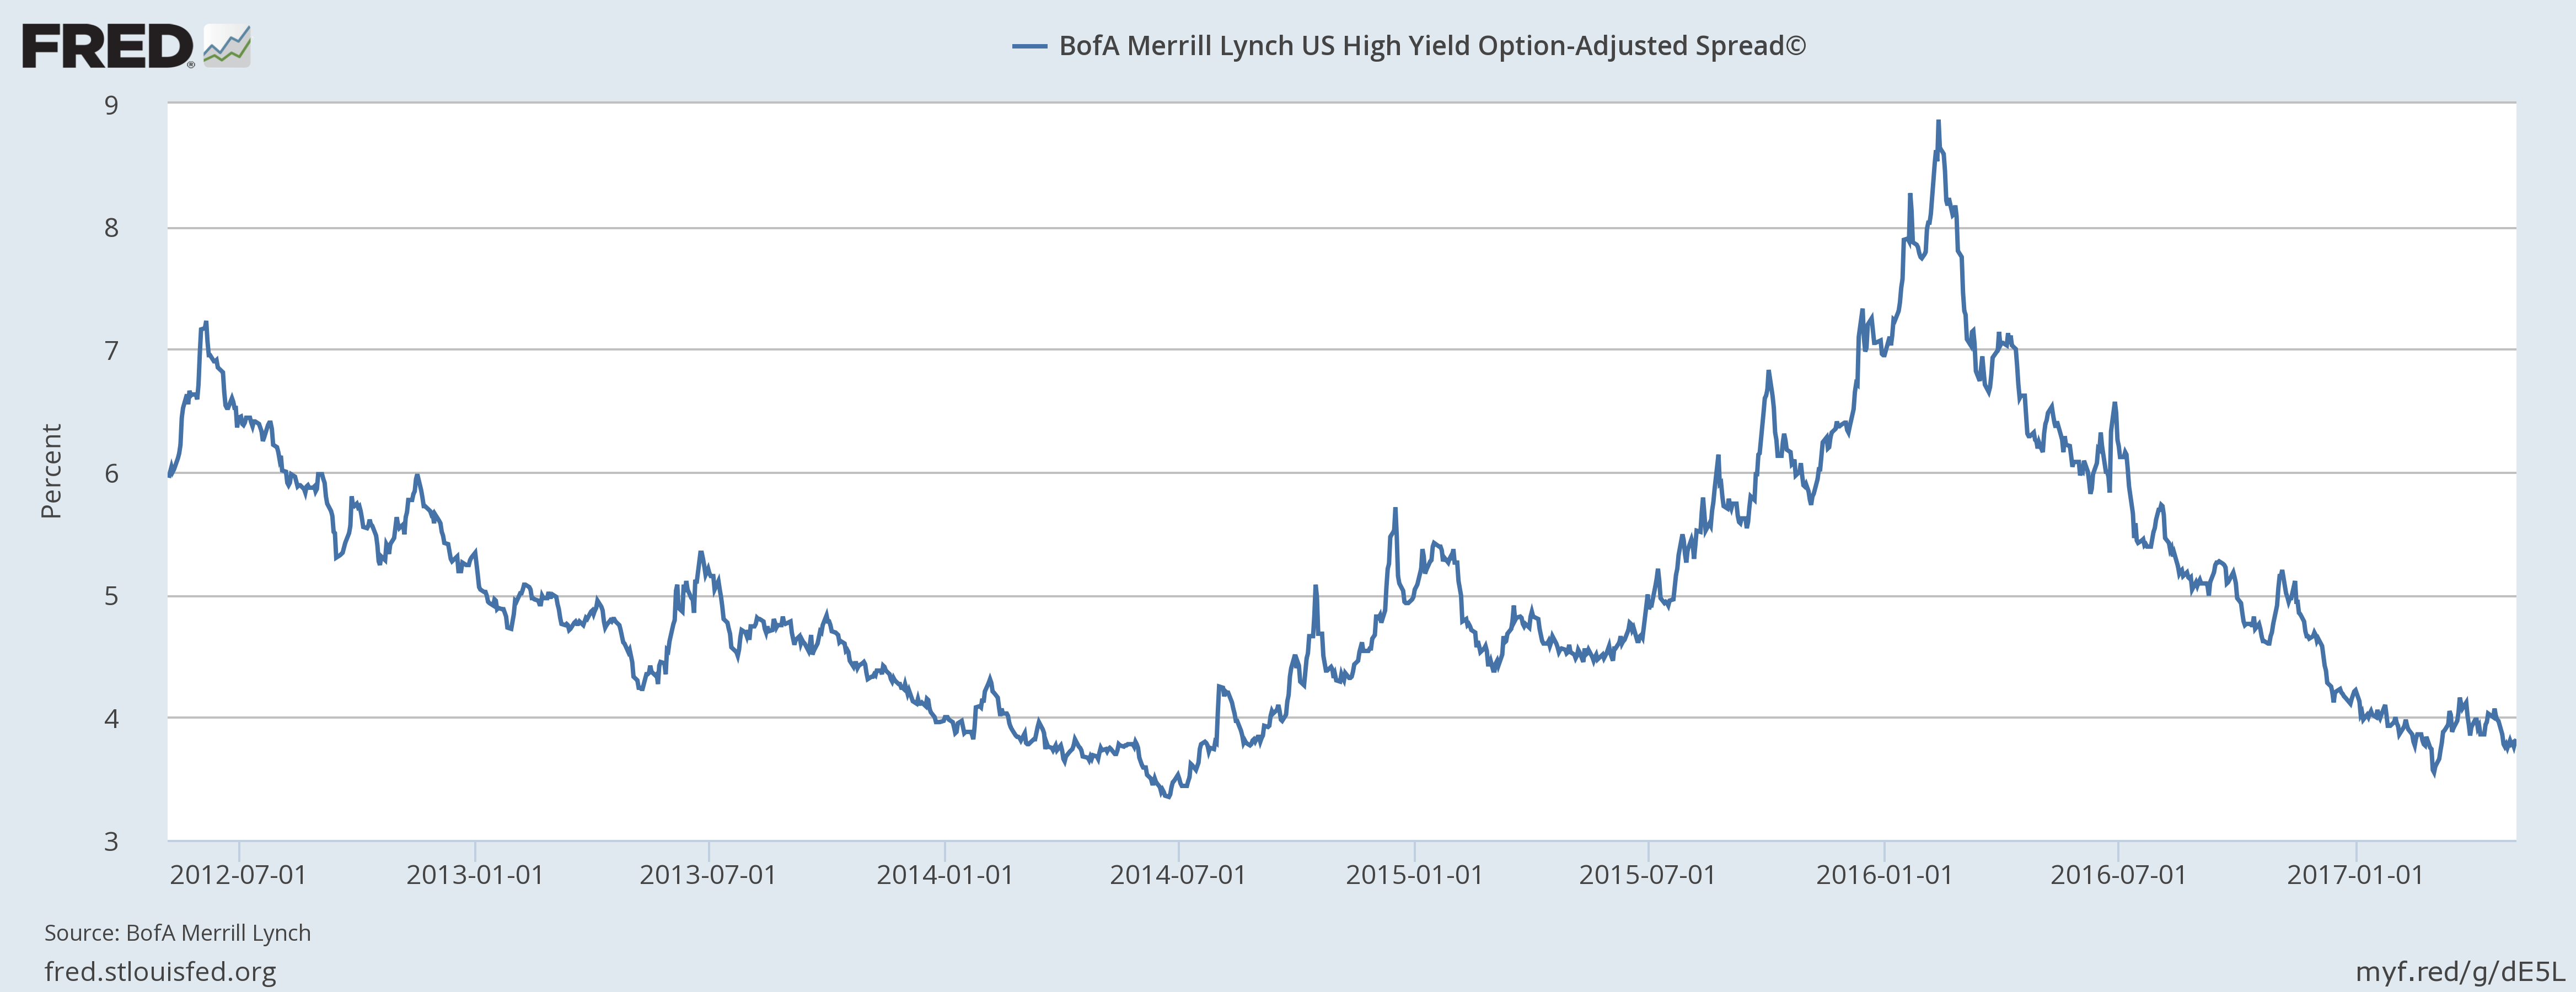
| Credit spreads actually tightened by 15 basis points despite the drop in oil prices. Spreads are still wider than the best levels of March. |
BofA Marrill Lynch US High Yield Option-Adjusted Spread 2012-2017 |
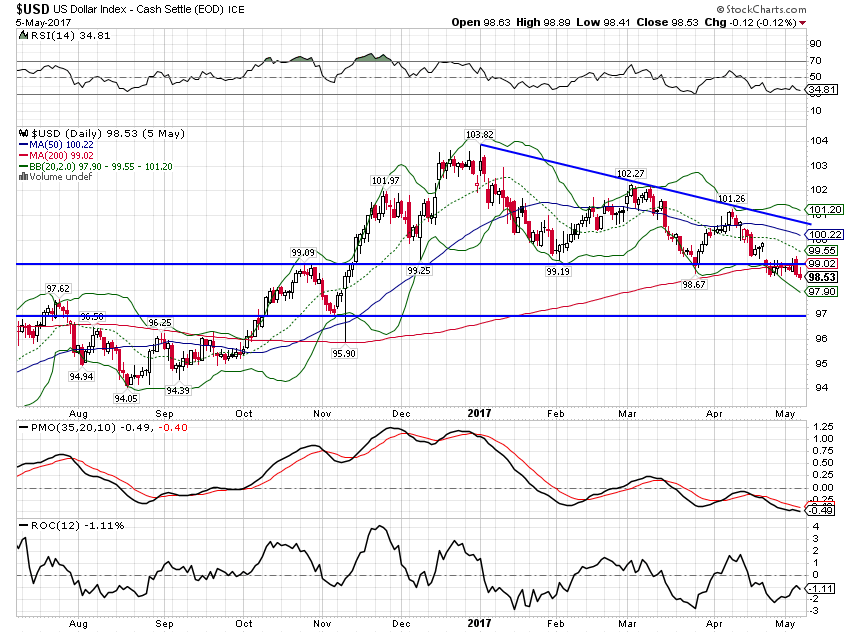
| The dollar index move wasn’t all that large either but the technical implications may be bigger. The 99 level I’ve been watching for months was finally broken to the downside. Next support would appear to be around 97. However, it should be noted that the extreme bullishness on the dollar – or bearishness on the Euro – has largely dissipated. Futures market positioning is no longer at an extreme with almost all the speculative Euro short positions now covered. Gains for the Euro – losses for the dollar index – will now likely be harder to come by. |
US Dollar Index(see more posts on U.S. Dollar Index, ) |
| Gold, like oil and most other commodities, ignored the fall in the dollar in favor of concentrating on what the Fed might do. The markets are now pricing in a 100% chance of another rate hike in June as the Fed ignores any negative reports and relies on the labor market to guide policy. Not surprising considering Yellen’s background as a labor economist but not inspiring considering the track record of the Phillips Curve. Nevertheless, the market seems to believe Yellen over their lyin’ eyes. Gold is still in a long term uptrend. |
Gold Continuous Contract(see more posts on gold price, ) |
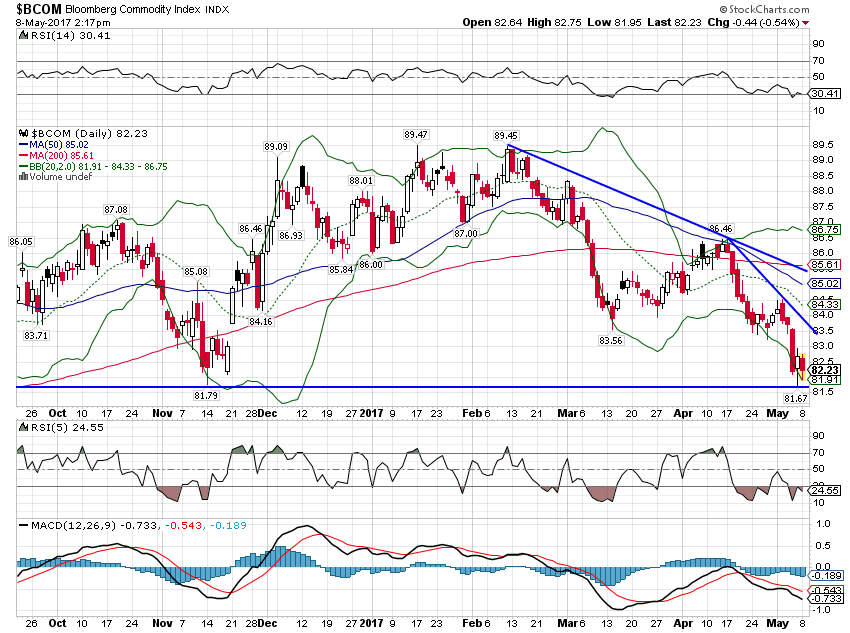
| Bloomberg Commodity Index is quite weak.
All in all, a very confusing set of indicators. Bond yields moved up a little, a slight improvement in growth expectations confirmed by the move lower in gold. But the dollar fell through support, a reflection of weaker growth expectations (at least relative to Europe) that is confirmed by weaker oil and other commodity prices. |
Bloomberg Commodity Index(see more posts on Bloomberg Commodity, ) |
The real challenge to the Fed’s rate hiking urgency will come if oil prices continue to fall. If the energy sector joins the retail sector and specifically the auto sector, some doubts may start to creep into the market regarding the expected Q2 rebound in growth. We don’t have any real evidence of renewed weakness but neither do we have any evidence of an acceleration yet. Indeed, maybe the best indicator is the one that is supposed to be a big picture indicator of growth, the Chicago Fed National Activity Index. That index was reported a couple of weeks ago at 0.08 with 0.0 indicating at trend growth. And the trend, in case you’ve forgotten is the new normal of 2%. Q1 growth was 1.92% year over year and Q2 so far looks no different.
This material has been distributed for informational purposes only. It is the opinion of the author and should not be considered as investment advice or a recommendation of any particular security, strategy, or investment product. Investments involve risk and you can lose money. Past investing and economic performance is not indicative of future performance. Alhambra Investment Partners, LLC expressly disclaims all liability in respect to actions taken based on all of the information in this writing. If an investor does not understand the risks associated with certain securities, he/she should seek the advice of an independent adviser.
Full story here Are you the author? Previous post See more for Next postTags: Alhambra Research,Bi-Weekly Economic Review,Bloomberg Commodity,Bonds,commodities,credit spreads,currencies,economic data,economic growth,Gold,gold price,newslettersent,OIL,TIPS,U.S. Dollar Index,U.S. Treasuries,US Dollar Index,Yield Curve


