Jeffrey P. Snider
My articles My offerMy siteAbout meMy videosMy books
Follow on:LinkedINTwitterSeeking Alpha
In June 2012, Janet Yellen, then the Vice Chairman of the Federal Reserve, addressed an audience in Boston with what for the time seemed like a radical departure. It was the latest in a string of them, for conditions throughout the “recovery” period never did quite seem to hit the recovery stride. Because of that, there was constant stream of trial balloons suggesting how the Federal Reserve might try to overcome this economic inertia.
At that juncture about five years ago, there were only whispers of “structural” economic forces conspiring against full recovery. As Ms. Yellen said in her speech:
All told, only about half of the collapse in private payroll employment in 2008 and 2009 has been reversed. A critical question for monetary policy is the extent to which these numbers reflect a shortfall from full employment versus a rise in structural unemployment. While the magnitude of structural unemployment is uncertain, I read the evidence as suggesting that the bulk of the rise during the recession was cyclical, not structural in nature.
One possible means for addressing the persistent shortfall was ostensibly the topic of her lecture. The term “optimal control” was not then a familiar one, though its academic use was already quite long by that time. It originated not in Economics but in the applied mathematics of engineering and the like. To truly determine the “optimal” option, so it was thought, thousands upon thousands of statistical simulations are run in order to plot the, as the name implies, ideal solution.
| Applying the idea to monetary economics, a central bank like the Fed may look upon the conditions of 2012 and realize easily their suboptimal nature. Under a “rules based” paradigm, like the Taylor Rule, the time even by then had already passed where the Fed “should” have been raising rates and “tightening.” Had they done so, however, that risked leaving so many on the wrong side of the employment divide. Using models like ferbus, the Fed staff seemed to have run projections that suggested what came to be known as “lower for longer.”
In orthodox terms, it simply meant that the Fed would “accommodate” beyond the stretch anyone had foreseen and allowing the inflation rate to rise above target for maybe even a prolonged period – all so that “cyclical” unemployment would be given enough time to more completely unwind. |
Federal Funds Rate 2010-2018(see more posts on Federal Funds Rate, )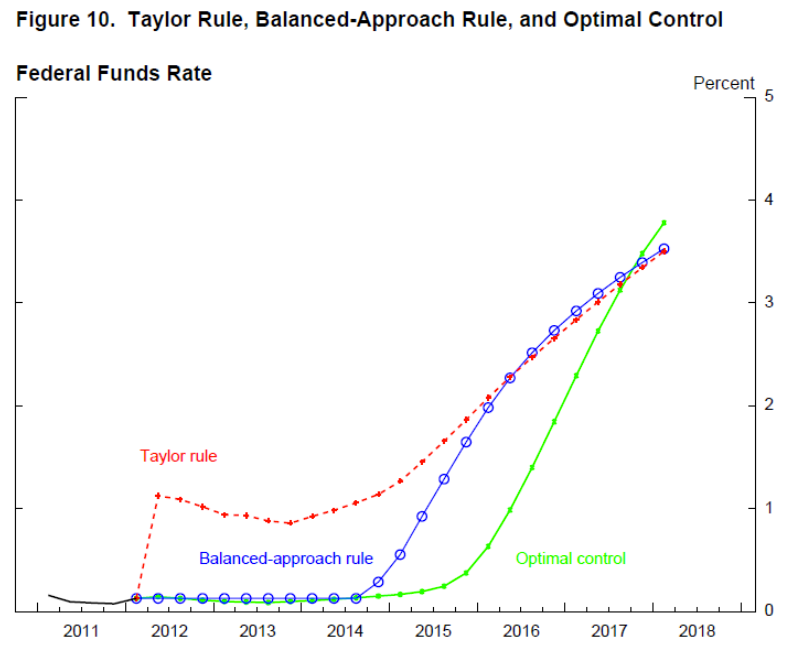 - Click to enlarge |
| As you can see above, a graphic taken directly from the material accompanying Yellen’s June 2012 speech, even under the “lower for longer” of “optimal control” rates would be well under way toward normalizing by the middle of 2016. By the middle of this year, it was expected that all these paths would converge such that cyclical unemployment would be stimulated away, inflation firmly and stably anchored right at 2%, and monetary policy rates nearing neutral and normal. |
Illustrative Economic Outlook(see more posts on U.S. Unemployment Rate, )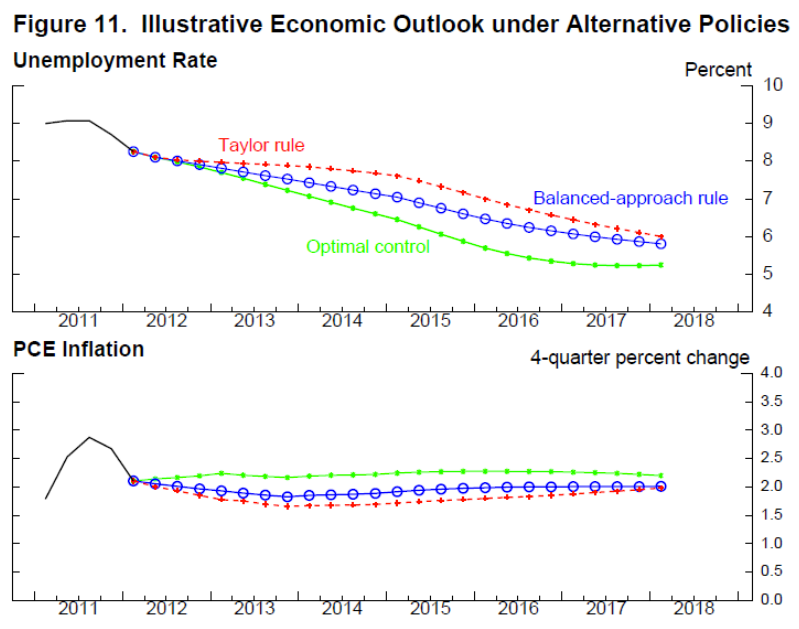 - Click to enlarge |
| What happens, then, when none of your projections are even close if not completely backward? To start with, just a few months after her Boston appearance, she and her fellow FOMC members all voted to start up another QE, the third, and then a few months after that raise the activity level in what was truly a fourth. While those could be classified as “lower for longer” and the means to achieve depth within that elongated policy window, in truth they were a reactive response to something wholly unanticipated – and, for the models, quite impossible. |
PCE Chain-type Price Index 2008-2017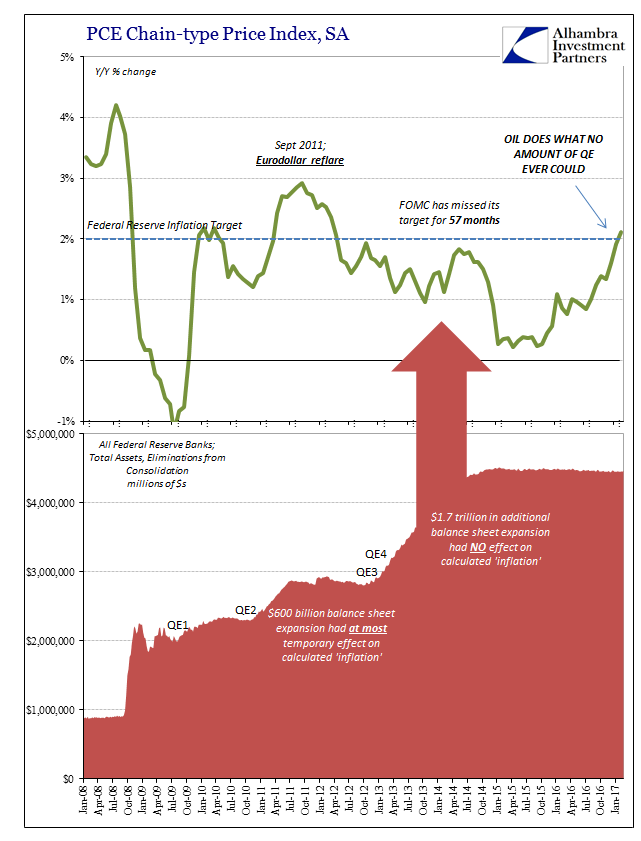 - Click to enlarge |
| In fact, over the next several years, the US economy turned, for Yellen and the Fed, upside down! Inflation, rather than staying up and allowing for cyclical unemployment to withdraw, started below the target and then collapsed by early 2015. The unemployment rate, which is supposed to move inverse to inflation, did the opposite by actually falling faster than even the most robust projections optimal control and otherwise. All the while this was going on, output as measured by GDP and any other statistics suddenly slowed. |
Unstable GDP Revision to More Stable = Weaker(see more posts on Gross Domestic Product, )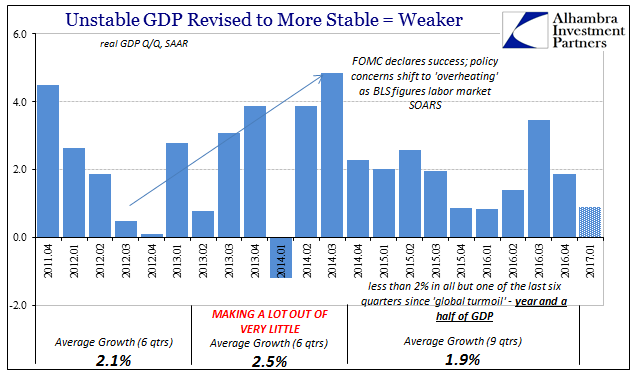 - Click to enlarge |
It really isn’t much to wonder why Fed officials seemed so utterly befuddled particularly in later 2015 and early 2016. Nothing (to them) was making any sense. That is why in the middle of 2016 the policy view of the economy was radically shifted yet again, this time to suspect, correctly, any considerable unemployment still left was not cyclical and therefore monetary policy, rules or not, was done. They take the unemployment rate at face value even if there was and is no recovery growth. As Yellen declared at her last press conference last month announcing the third “rate hike”, they do so regardless of the state of output:
The only factor for monetary policy now is the max federal funds rate. Back in February 2014, just a few weeks into her tenure as Chairman, Yellen told the Senate Banking Committee:
What she meant was that official monetary policy about QE, balance sheet expansion, or anything else non-standard views them to be only last resort methods. Given the mainstream outlook at that time, it was uncontroversial to state that only interest rate “accommodation” would be needed for the next inevitable recession. She was looking at the future as if those 2012 projections were about to come true. |
Potential Real GDP 2005-2019 - Click to enlarge |
| In the three years since that testimony, however, this remains the Fed’s position even though the US and world economy today is nothing at all like what it was supposed to be. The overriding goal of monetary policy is to get as high and as normal as possible in order to “have adequate ability through our normal interest rate moves” to fight the next cyclical downturn.
Reconciling all this, however, it’s as if the Great “Recession” had for the Fed simply never happened. The only trace of it is in that max federal funds rate, which as of this year so far isn’t projected to get much beyond an entirely optimistic 3%. |
Eurodollar Futures Curve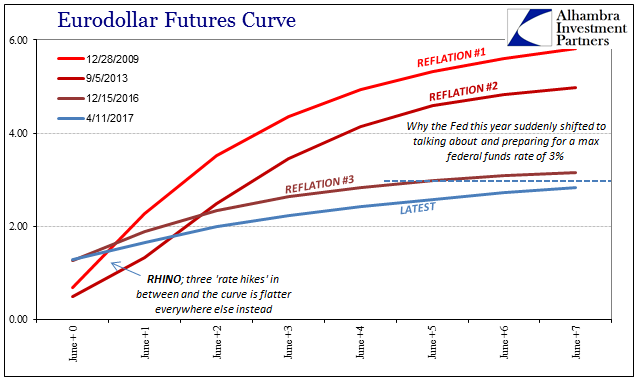 - Click to enlarge |
| After spending a decade fighting, futilely, against it, the whole thing is now just quirky history to be archived in the basement of their DC headquarters. Fed officials have learned nothing from anything, starting with interest rate “accommodation.” The fact that none of their projections for either inflation or unemployment worked out favorably despite two additional QE’s as well as “lower for longer” should call into question what interest rate “stimulus” might actually be.
In fact, the history of the Fed’s use of the federal funds rate to achieve its economic aims has been the one constant mode of failure going back to the earliest days of the crisis. In early 2007, the federal funds rate was a fat 5.25% after Alan Greenspan’s last act as Chairman. And just as his Fed raised the target from 1% to 5.25%, Bernanke’s Fed lowered it from 5.25% to 1% by late 2008. Like 2014 forward, nothing behaved as it was “supposed to” at that time, either. |
CPI Changes On Energy 1995-2010(see more posts on U.S. Consumer Price Index, )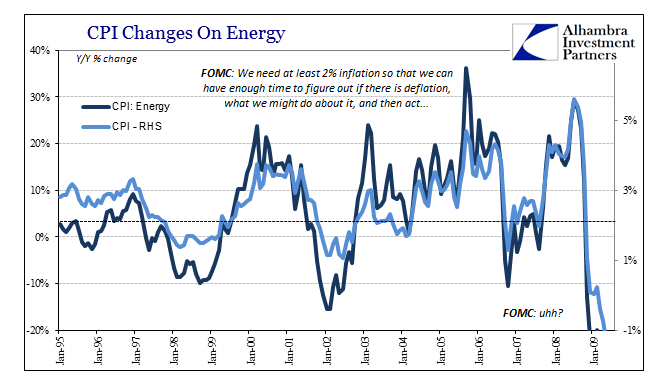 - Click to enlarge |
| Inflation at first skyrocketed, so that the PCE Deflator was over 4% in both June and July 2008 – only to drop to zero in just five months, and then below it just two months after that. In other words, it didn’t seem to matter at all then, or now, what the federal funds rate was to influence inflation, unemployment, or output – the three variables that are supposed to describe the whole of their job. The entire monetary policy paradigm broke down in 2008 and 2009, and then never went back to normal.
Despite that, the Federal Reserve is trying to do just that again as if none of it ever happened. That is the fruit of the “skills mismatch” or productivity mystery for policymakers because it allows them to, they believe, declare the whole last decade as structural and therefore all these abnormalities, nothing but abnormalities, somebody else’s problem. |
Functional Monetary Policy from 2007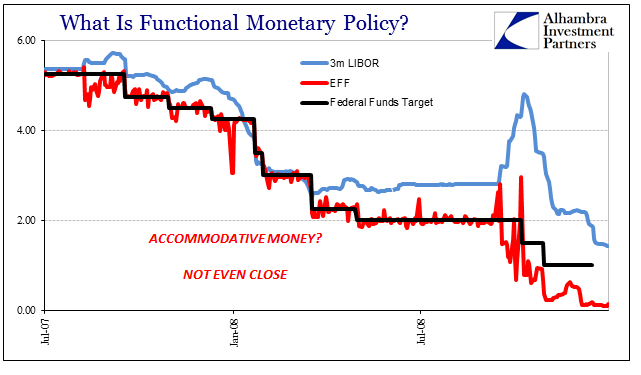 - Click to enlarge |
| It is an absolutely preposterous position to take, and one that the bond market, as well as funding markets, is increasingly at odds with. Ever since the last “rate hike” last month, eurodollar futures in particular have been persistently bid in what is the “wrong” direction. But it is only the “wrong” direction if you believe as the Fed does. It’s relatively easy for academics to just ignore the last ten years and puzzle about them as if some bookish historical curiosity, the rest of the world can obtain no such luxury having to instead live with the consequences. They passed right on by “optimal control” straight into lunacy. There is absolutely no reason why we have to follow. |
Optimal Control 2016-2017 - Click to enlarge |
UST Curve Shape 2013-2017(see more posts on US Treasury, ) - Click to enlarge |
Tags: balance sheet capacity,currencies,depression,dollar,dollar shortage,economy,EuroDollar,eurodollar futures,Federal Funds Rate,Federal Reserve/Monetary Policy,federal-reserve,FOMC,global dollar short,Gross Domestic Product,interest rate swaps,Markets,Monetary Policy,money,newslettersent,rising dollar,swap spreads,U.S. Consumer Price Index,U.S. Treasuries,U.S. Unemployment Rate,US Treasury,Yield Curve