Joseph Y. Calhoun
My articles My siteAbout meMy videosMy books
Follow on:LinkedINTwitterSeeking AlphaAmazon
It wasn’t a very good two weeks for economic data with the majority of reports disappointing. Most notable I think is that the so called “soft data” is starting to reflect reality rather than some fantasy land where President Trump enacts his entire agenda in the first 100 days of being in office. Politics is about the art of the possible and that is proving a short list for now. Republicans can’t agree among themselves and Democrats are following the golden rule of politics – never interfere when your opponent is busy self-destructing. I said after the election that tax reform would be a 2018 event at the earliest. I may have been too optimistic.
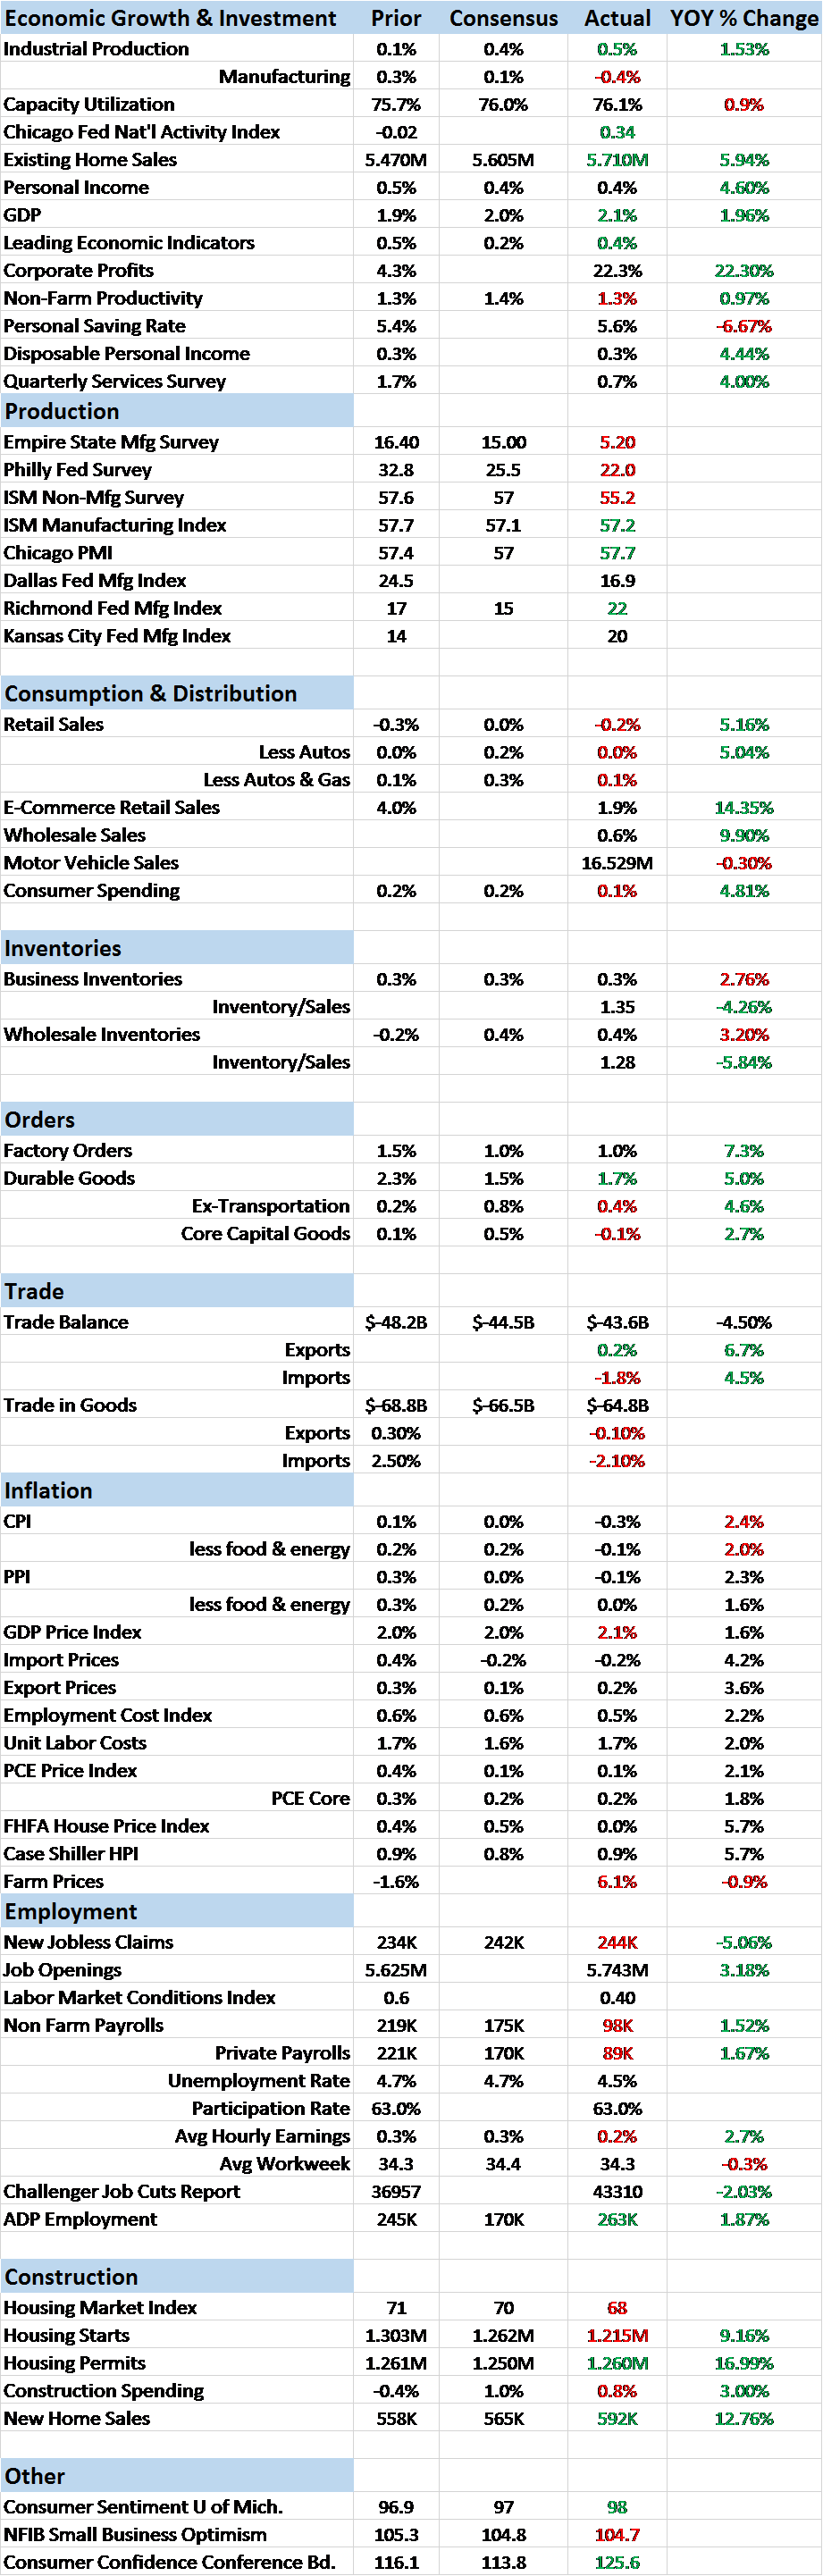
The energy sector-led economic slowdown that started a couple of years ago has only been partially reversed by the retracement of crude prices to the $50s. Supposedly the shale industry has reduced breakeven prices for a lot of the existing fields so if prices pull back here it won’t have the same impact it had in 2014-15 but that may not matter all that much. It seems that as the energy sector has healed somewhat, other sectors are starting to take its place. In particular, the retail industry appears to be in a mite of trouble recently with bankruptcies, layoffs and store closures ramping up. Some of that is probably due to the Amazon effect but the latest retail sales report wasn’t all that encouraging either. Overall, sales were down 0.2% and ex-autos were flat. That highlights one of the emerging problem areas – autos. Business inventories were reported up and a big part of that was vehicle inventory.
And while Industrial Production was up more than expected, that was due to a huge ramp up in utility output. The manufacturing part of the report was a big disappointment, down 0.4% led by a slowdown in business equipment, building supplies and yes, autos. In addition, some of that soft data on the manufacturing side is fading too. Both the Empire State and Philly Fed reports were less than expected, although still fairly positive. Two employment reports also pointed to weakness or maybe just the absence of strength. The Labor Market Conditions index fell to 0.40 while the JOLTS report showed a 2.1% jump in job openings. That second one sounds pretty good but as I said in the last update, you have to put it in context. Job openings were indeed up from last month but are also about the same as they were in the spring of 2015. And hires – which seem a bit more important than openings – were down 2.4% year over year.
There were some positives reported over the last two weeks, mostly in real estate. Housing starts were a bit disappointing but permits were better than expected and the trend in new home sales (which are reported next week) is definitely higher. Existing home sales are also accelerating and new inventory is being rapidly absorbed. Homebuilders remain confident – the housing market index came in at 68. That was a little less than expected but continues the run of greater than 50 readings that indicate expansion. Leading Economic Indicators were also positive, up 0.4% although some of that gain was based on those “soft” data points.
Inflation isn’t a problem with both CPI and PPI showing falling prices in the latest reports. Price softness at the wholesale level was widespread, not what one would expect if demand was robust. A big part of that is falling energy prices but not all and food prices were actually higher. At the consumer level, energy prices also pulled down the total with gasoline down over 6% on the month. But prices were also down at the core level with, again, widespread price softness. Apparel and transportation (autos again) were both down while communications fell a precipitous 3.5%, a consequence of the cellular price war.
| Overall, the economic environment is still fairly weak. It isn’t a-recession-is-right-around-the-corner weak but still, a lot less than the economic bulls were hoping for. The weakness is also reflected in our market based indicators. The yield curve flattened by 7 basis points since my last update and now 32 basis points since peak Trump euphoria steepness in mid-December. The 10/2 curve is still steeper than it was last August but all the steepening since the election has been reversed. The flattening is due to long rates falling faster than short rates, the return of Greenspan’s conundrum. Economists will debate endlessly what this means but I lean toward Occam’s Razor – it means the long end of the curve isn’t buying the growth story being peddled by the Fed. Just as it didn’t in the last tightening cycle – accurately I might add. |
10-Year Treasury Constant Maturity, 1994 - 2016(see more posts on U.S. Treasuries, ) - Click to enlarge |
| Nominal and real yields both fell but nominal fell more as inflation expectations waned. Growth expectations in the bond market (nominal and real) peaked in mid-December but have accelerated to the downside since March. |
10-Year Treasury Constant Maturity Rate, 2000 - 2017(see more posts on U.S. Treasuries, )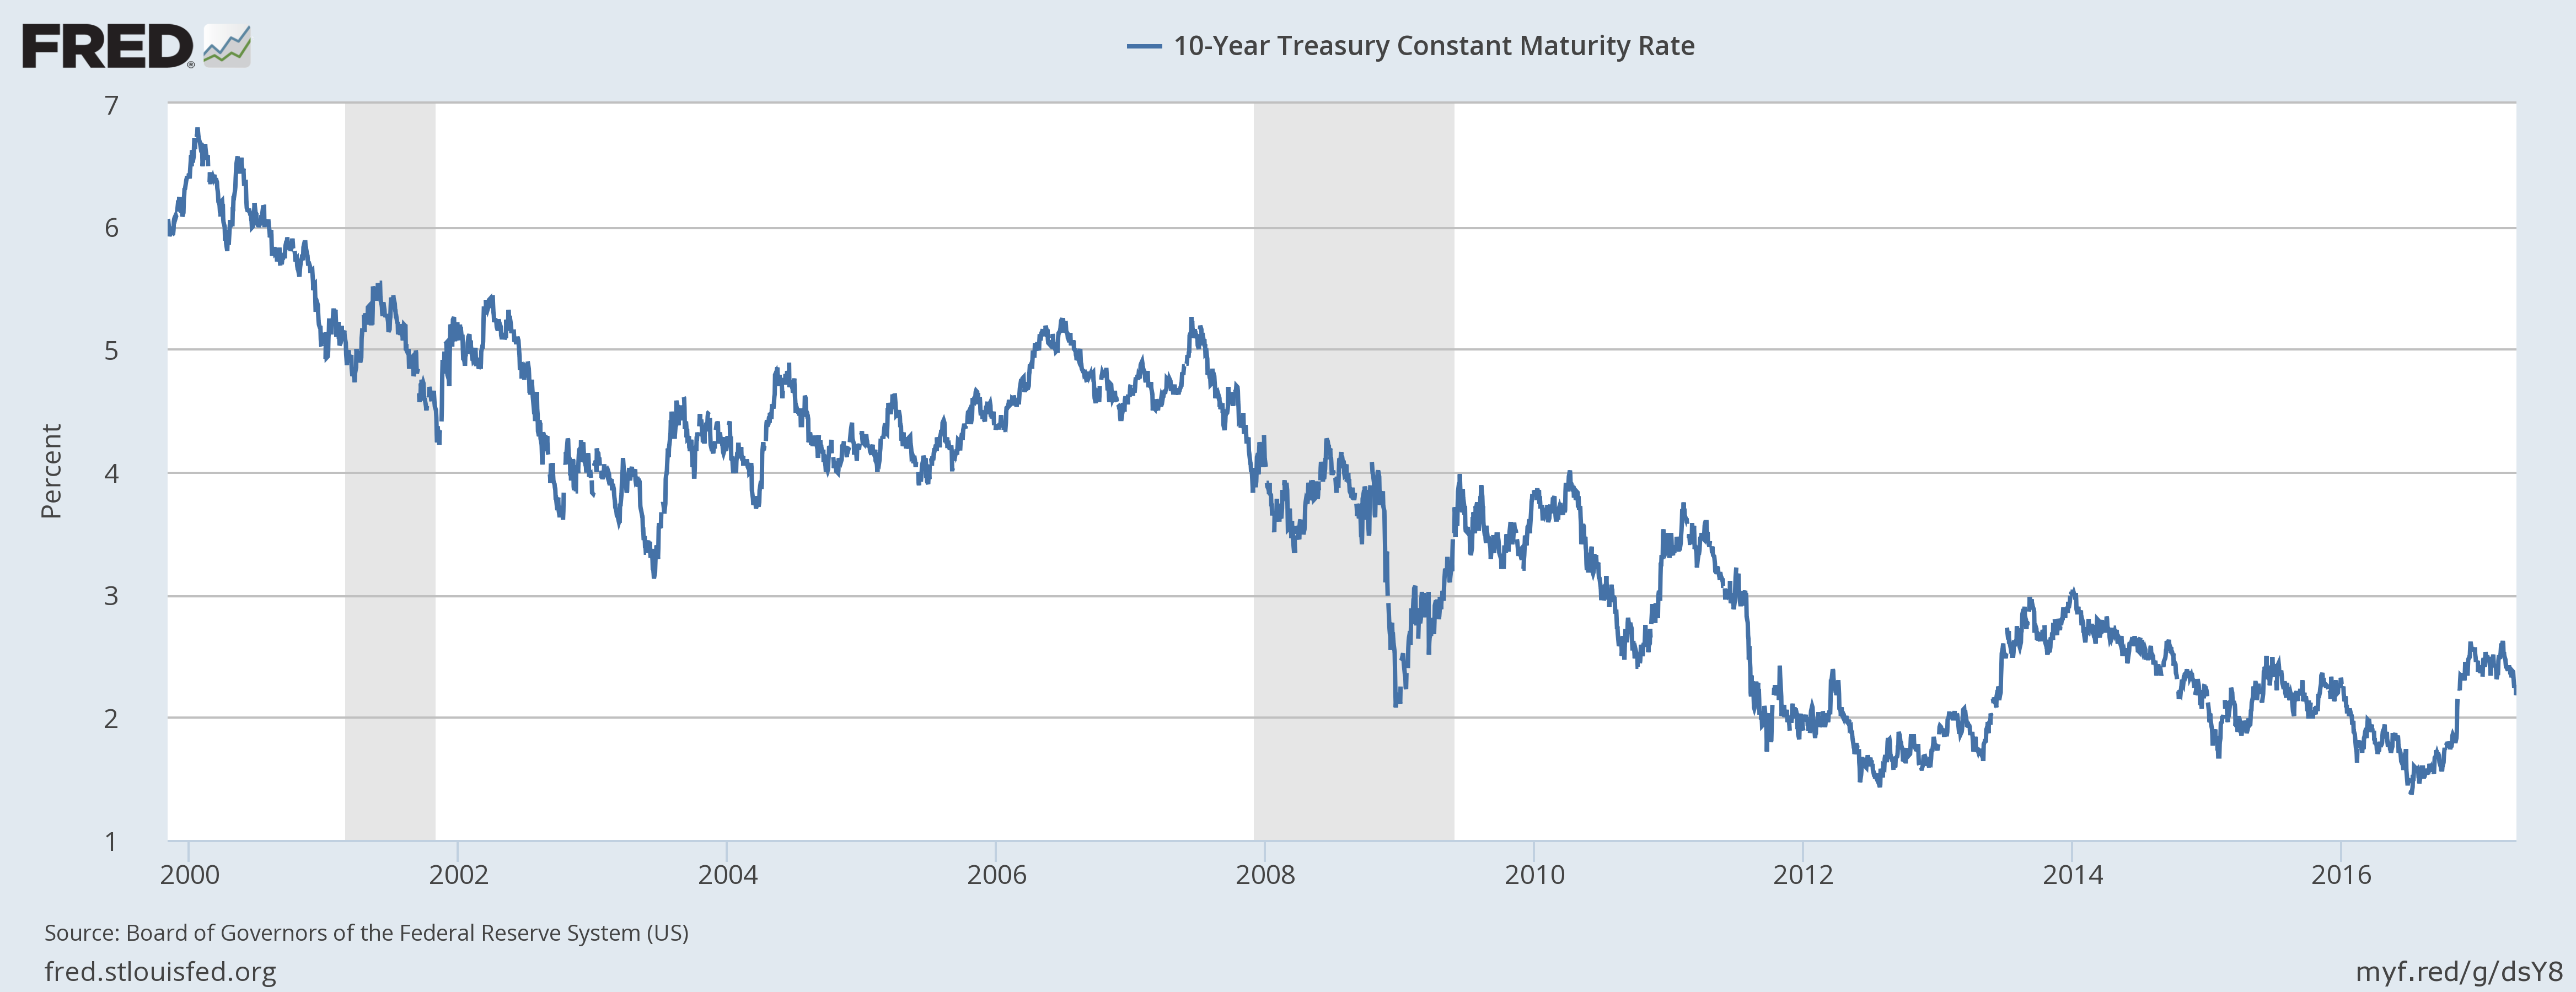 - Click to enlarge |
10-Year Treasury Inflation-Indexed Security, Jul 2012 - Jan 2017(see more posts on U.S. Treasuries, )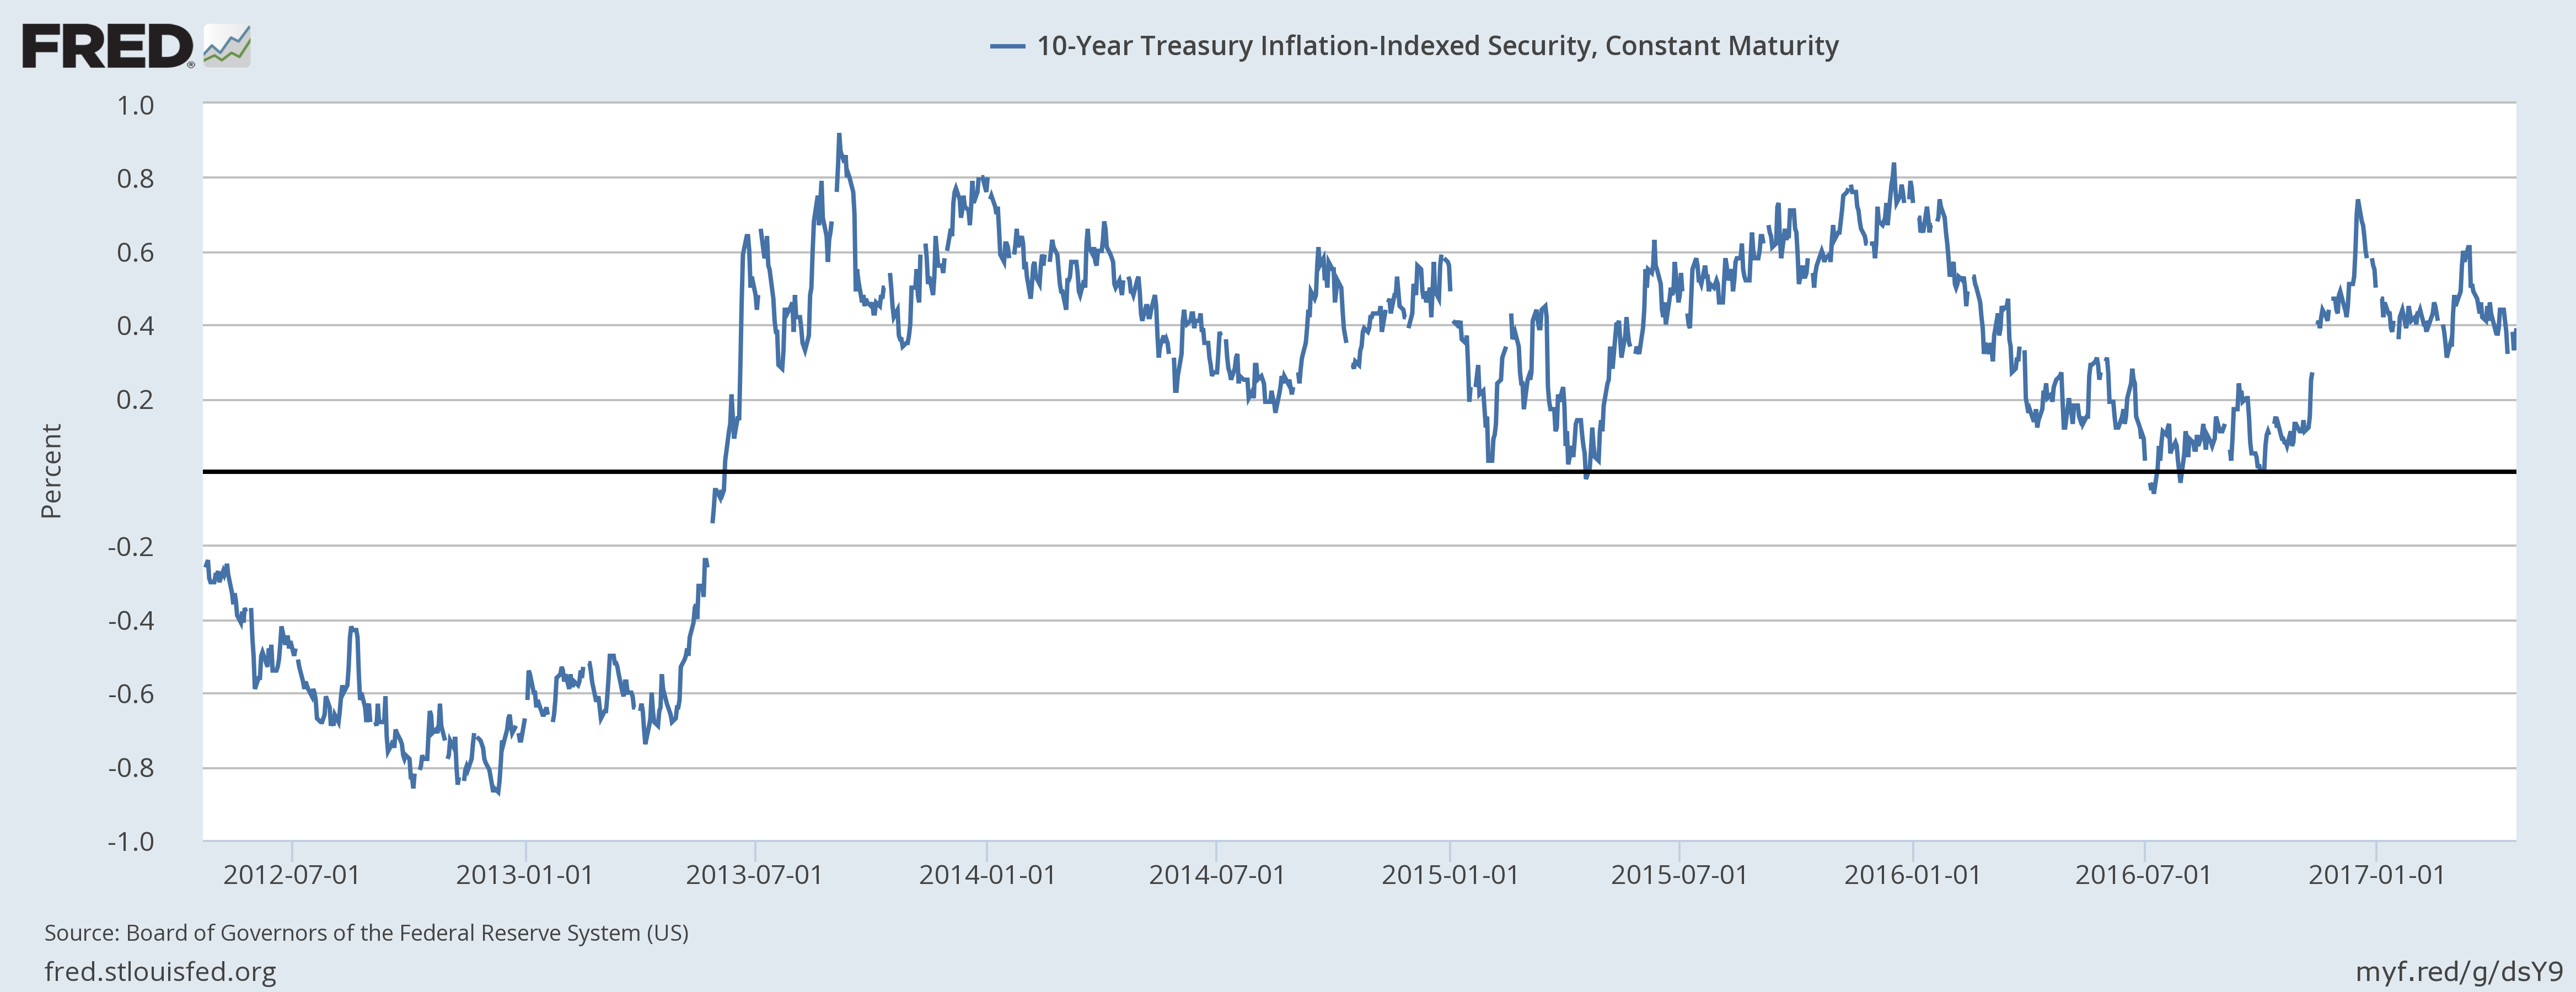 - Click to enlarge |
|
| Credit spreads widened about 12 basis points over the last two weeks but are still low. I suspect the junk bond market is no longer as sensitive to oil prices as it was prior to the shale shakeout but there are plenty of other sectors to worry about. One area of the economy where growth hasn’t been a problem is in the issuance of debt, especially the corporate variety. Investment grade corporate debt issuance hit a 6th consecutive annual record in 2016. |
BofA Merril Lynch US High Yield Option-Adjusted Spread, Jul 2010 - Jan 2017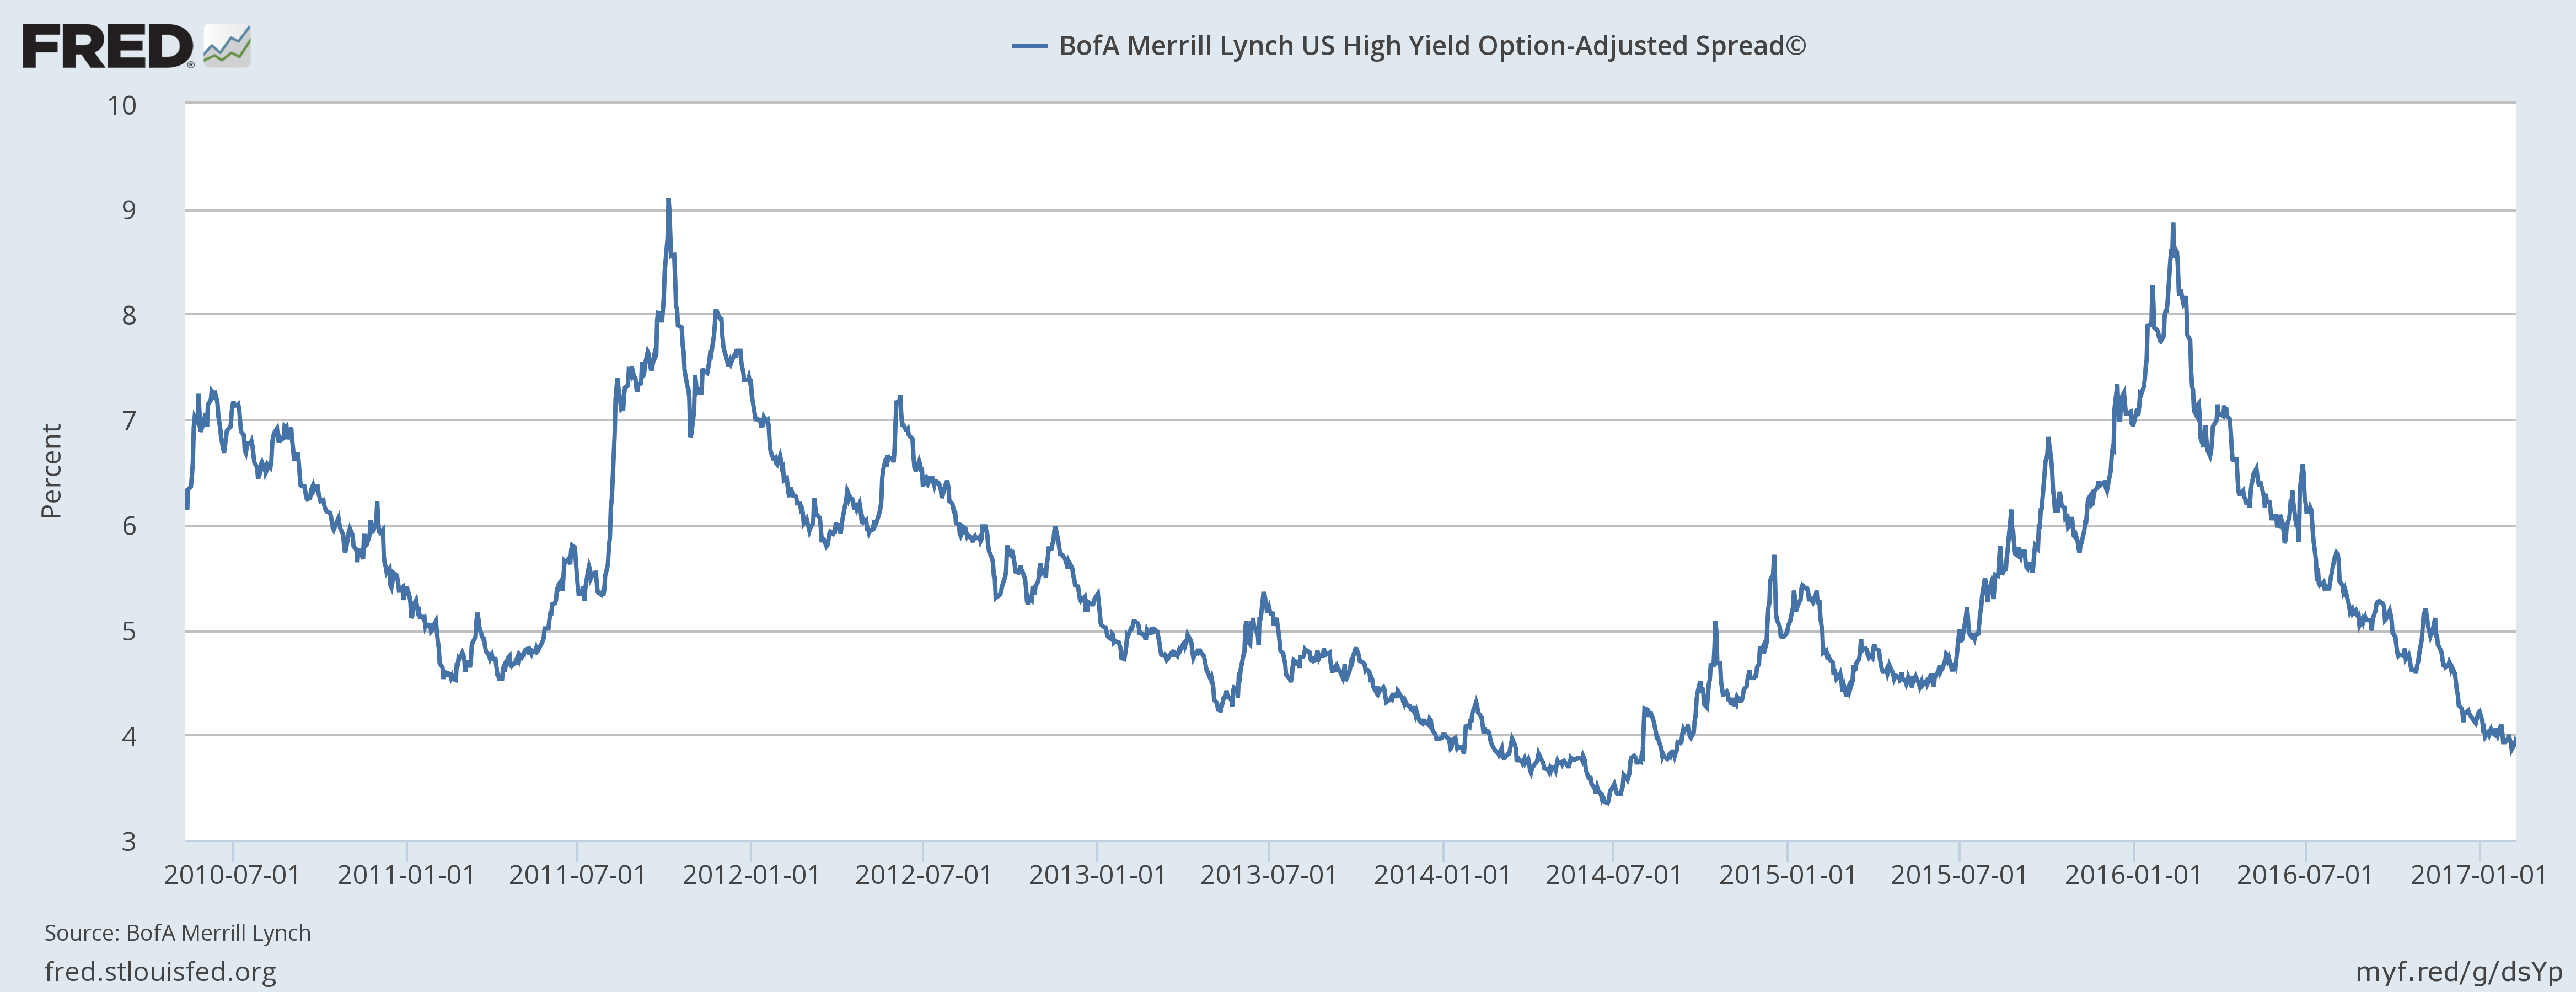 - Click to enlarge |
| As I said in the last update, the dollar topping process continues, just another reflection of weak growth expectations for the US. With Europe looking a little better – just cyclically – and the US looking a little worse, capital seems to be flowing back to the Euro. How the dollar resolves over the coming weeks and months – higher or lower – could have a big impact on portfolios. 99 seems to be a key level: |
US Dollar Index, Jul 2016 - Apr 2017(see more posts on U.S. Dollar Index, ) - Click to enlarge |
| The recent dollar weakness has been a positive for gold, another sign of growth skepticism. Gold resumed its long term uptrend in 2016 and the short term trend is now higher too. Pretty stiff long term resistance will come in – assuming the rally gets that far – at around $1400; short term resistance is much closer by. The gold uptrend is supported by 5 year TIPS yields that recently turned negative again. Not much opportunity cost for holding the yellow metal. |
Gold, Daily Oct 2016 - Apr 2017(see more posts on Gold, )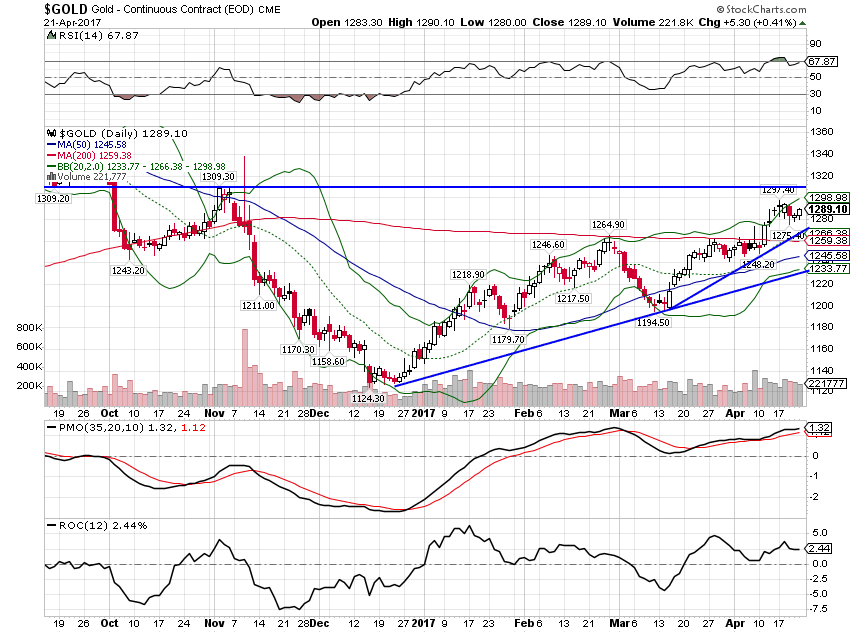 - Click to enlarge |
| Long term uptrend: |
Gold, Monthly Jul 2005 - Apr 2017(see more posts on Gold, ) - Click to enlarge |
| 5 Year TIPS
US growth expectations continue to wane. Interest rates and the dollar are falling, gold is rising. Stocks have stalled since the beginning of March as investors and traders reassess the political situation. That’s true on a global basis as well; the French election could conceivably have an impact on markets by the time you read this. I don’t think so and if it does it will probably be short lived but it could conceivably move markets. Of more importance is likely the course of the Trump agenda whatever that might be. He has promised to release this week some details of an outline of some things he’d like to be in any possible tax reform bill that someone might write someday. And health care reform will come right before or right after tax reform. I don’t know if the Trump administration will be able to enact any major reforms this year but clearly skepticism in the market is growing. That probably needs to change fairly soon as markets that reflect a weaker growth outlook can be somewhat self-fulfilling. A yield curve that flattens as growth expectations wane has an impact on the real economy. Credit spreads that widen due to fears of default may create the very defaults investors are trying to avoid. Neither the yield curve nor credit spreads are warning of imminent recession, but economic momentum seems to have shifted. Tick, tock. |
5 Year Treasury Inflation-Indexed Security, Jul 2012 - Jan 2017(see more posts on U.S. Treasuries, )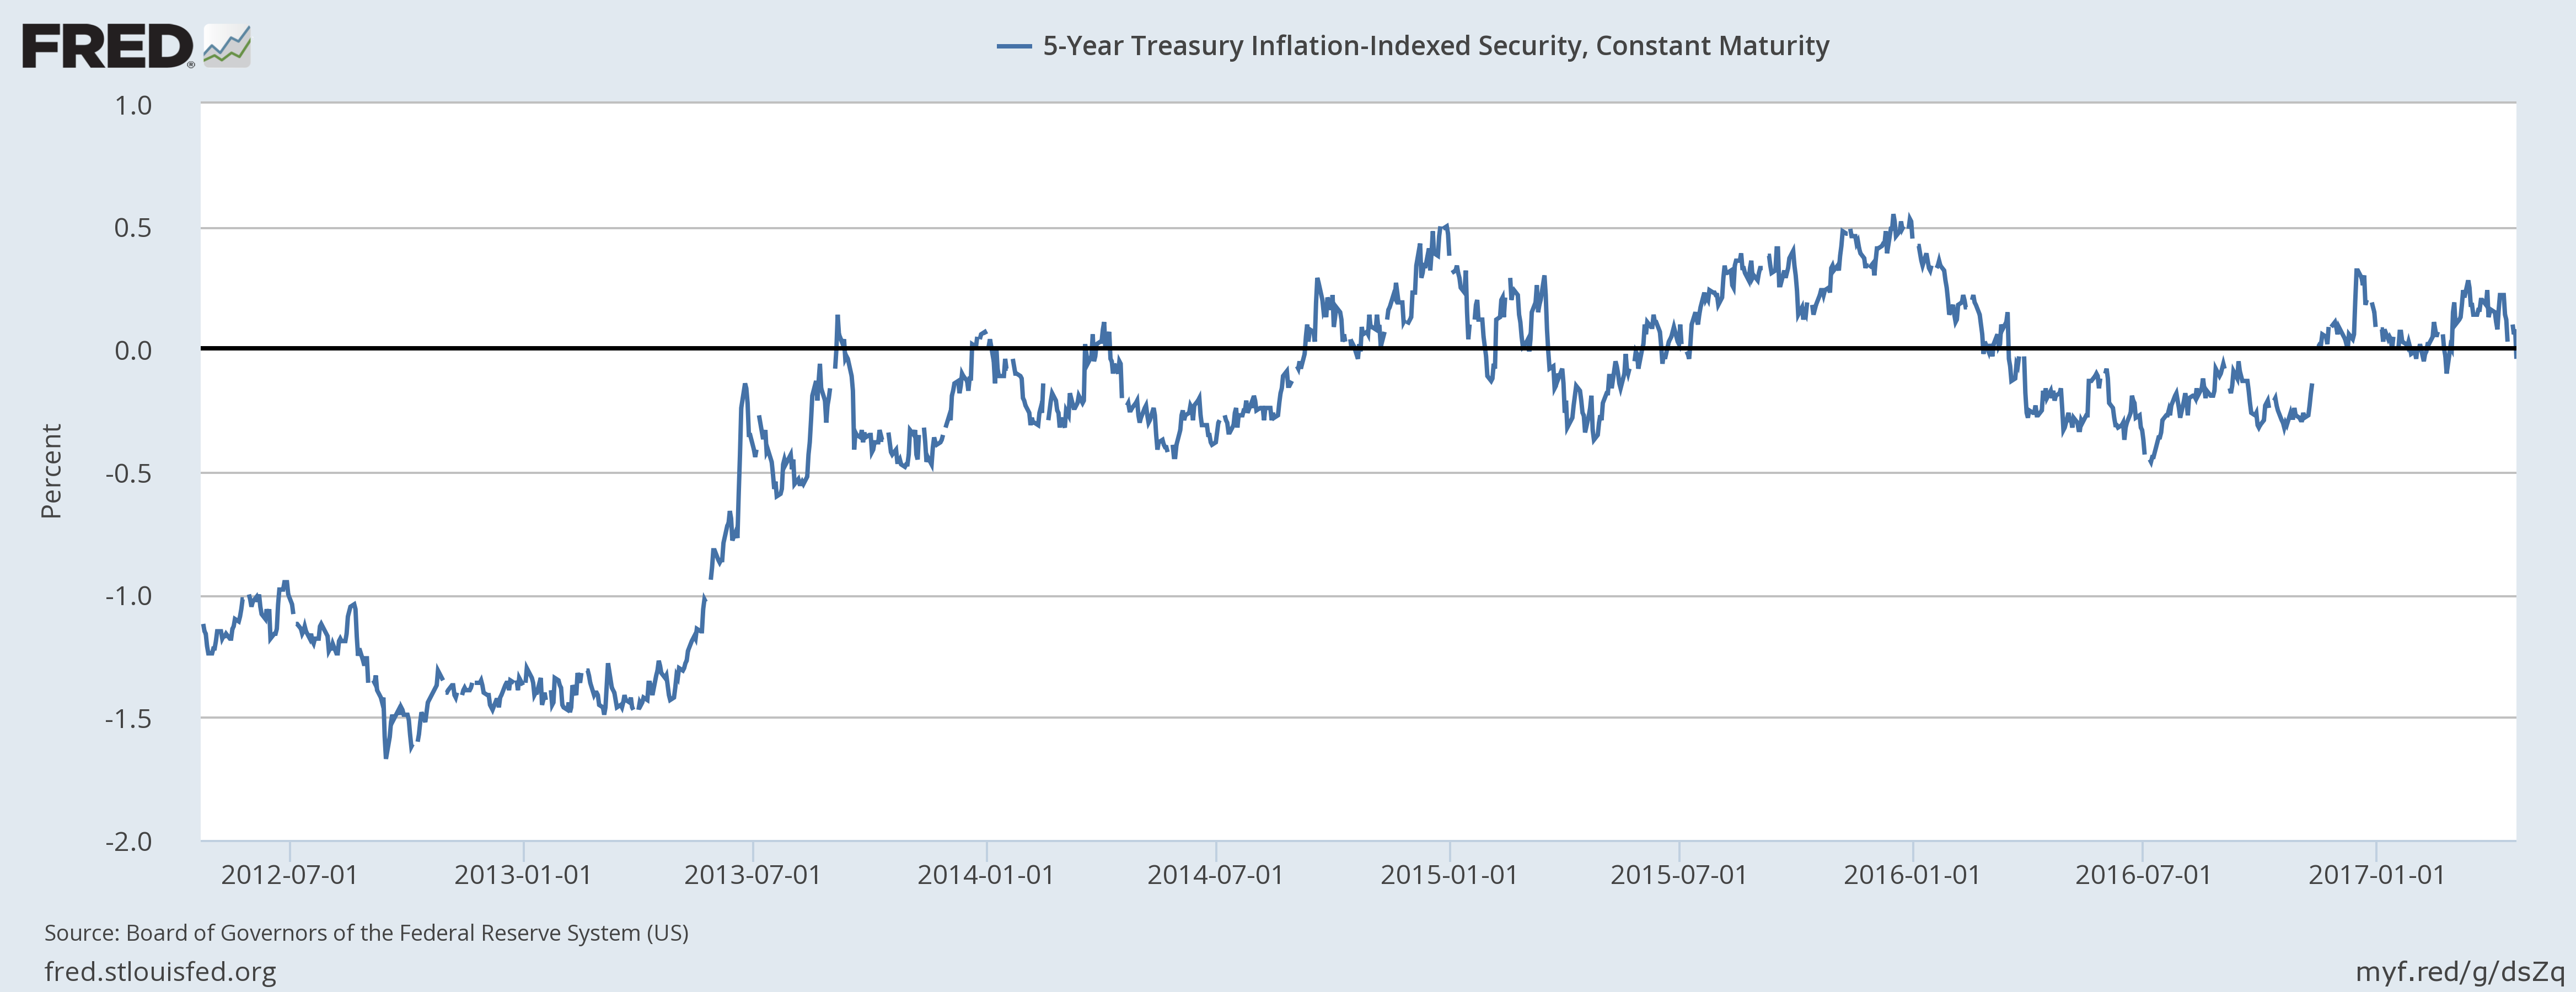 - Click to enlarge |
Tags: Alhambra Research,Bi-Weekly Economic Review,Bonds,commodities,credit spreads,currencies,economic data,economic growth,economy,Gold,inflation,Interest rates,Markets,newslettersent,Politics,Real Estate,real interest rates,stocks,TIPS,U.S. Dollar Index,U.S. Treasuries,US dollar,Yield Curve