


Joseph Y. Calhoun
My articles My siteAbout meMy videosMy books
Follow on:LinkedINTwitterSeeking AlphaAmazon

It is hard not to notice that the chart above has a lot less red in it than it has in some time. That is true of the month to month data as well as the year over year changes. There has been a widely reported gap between so called soft data – surveys and polls – and the hard data – actual economic activity reports. Bulls say the gap is there because the soft data always leads the hard data. Bears say the soft data surge is about policy changes that aren’t happening, at least not yet and maybe not for quite a while. But the real problem is that there is no context to the data, whether month to month or year over year. Yes, the YOY numbers are better than last year – but are they good? Unfortunately, the answer to that question is no in many cases.
| Take Factory Orders as an example, a report released last week. On the surface it looks like a very encouraging report. Orders were up 1.0% from last month and last month was revised higher from an initially reported 1.2% gain to 1.5%. Year over year orders were up 7.3%. The month to month figure was in line with expectations. There was some disappointment in the capital goods part of the report but overall, pretty good, right? Let’s add that context we talked about. |
US New Orders, 1994 - 2016(see more posts on new orders, )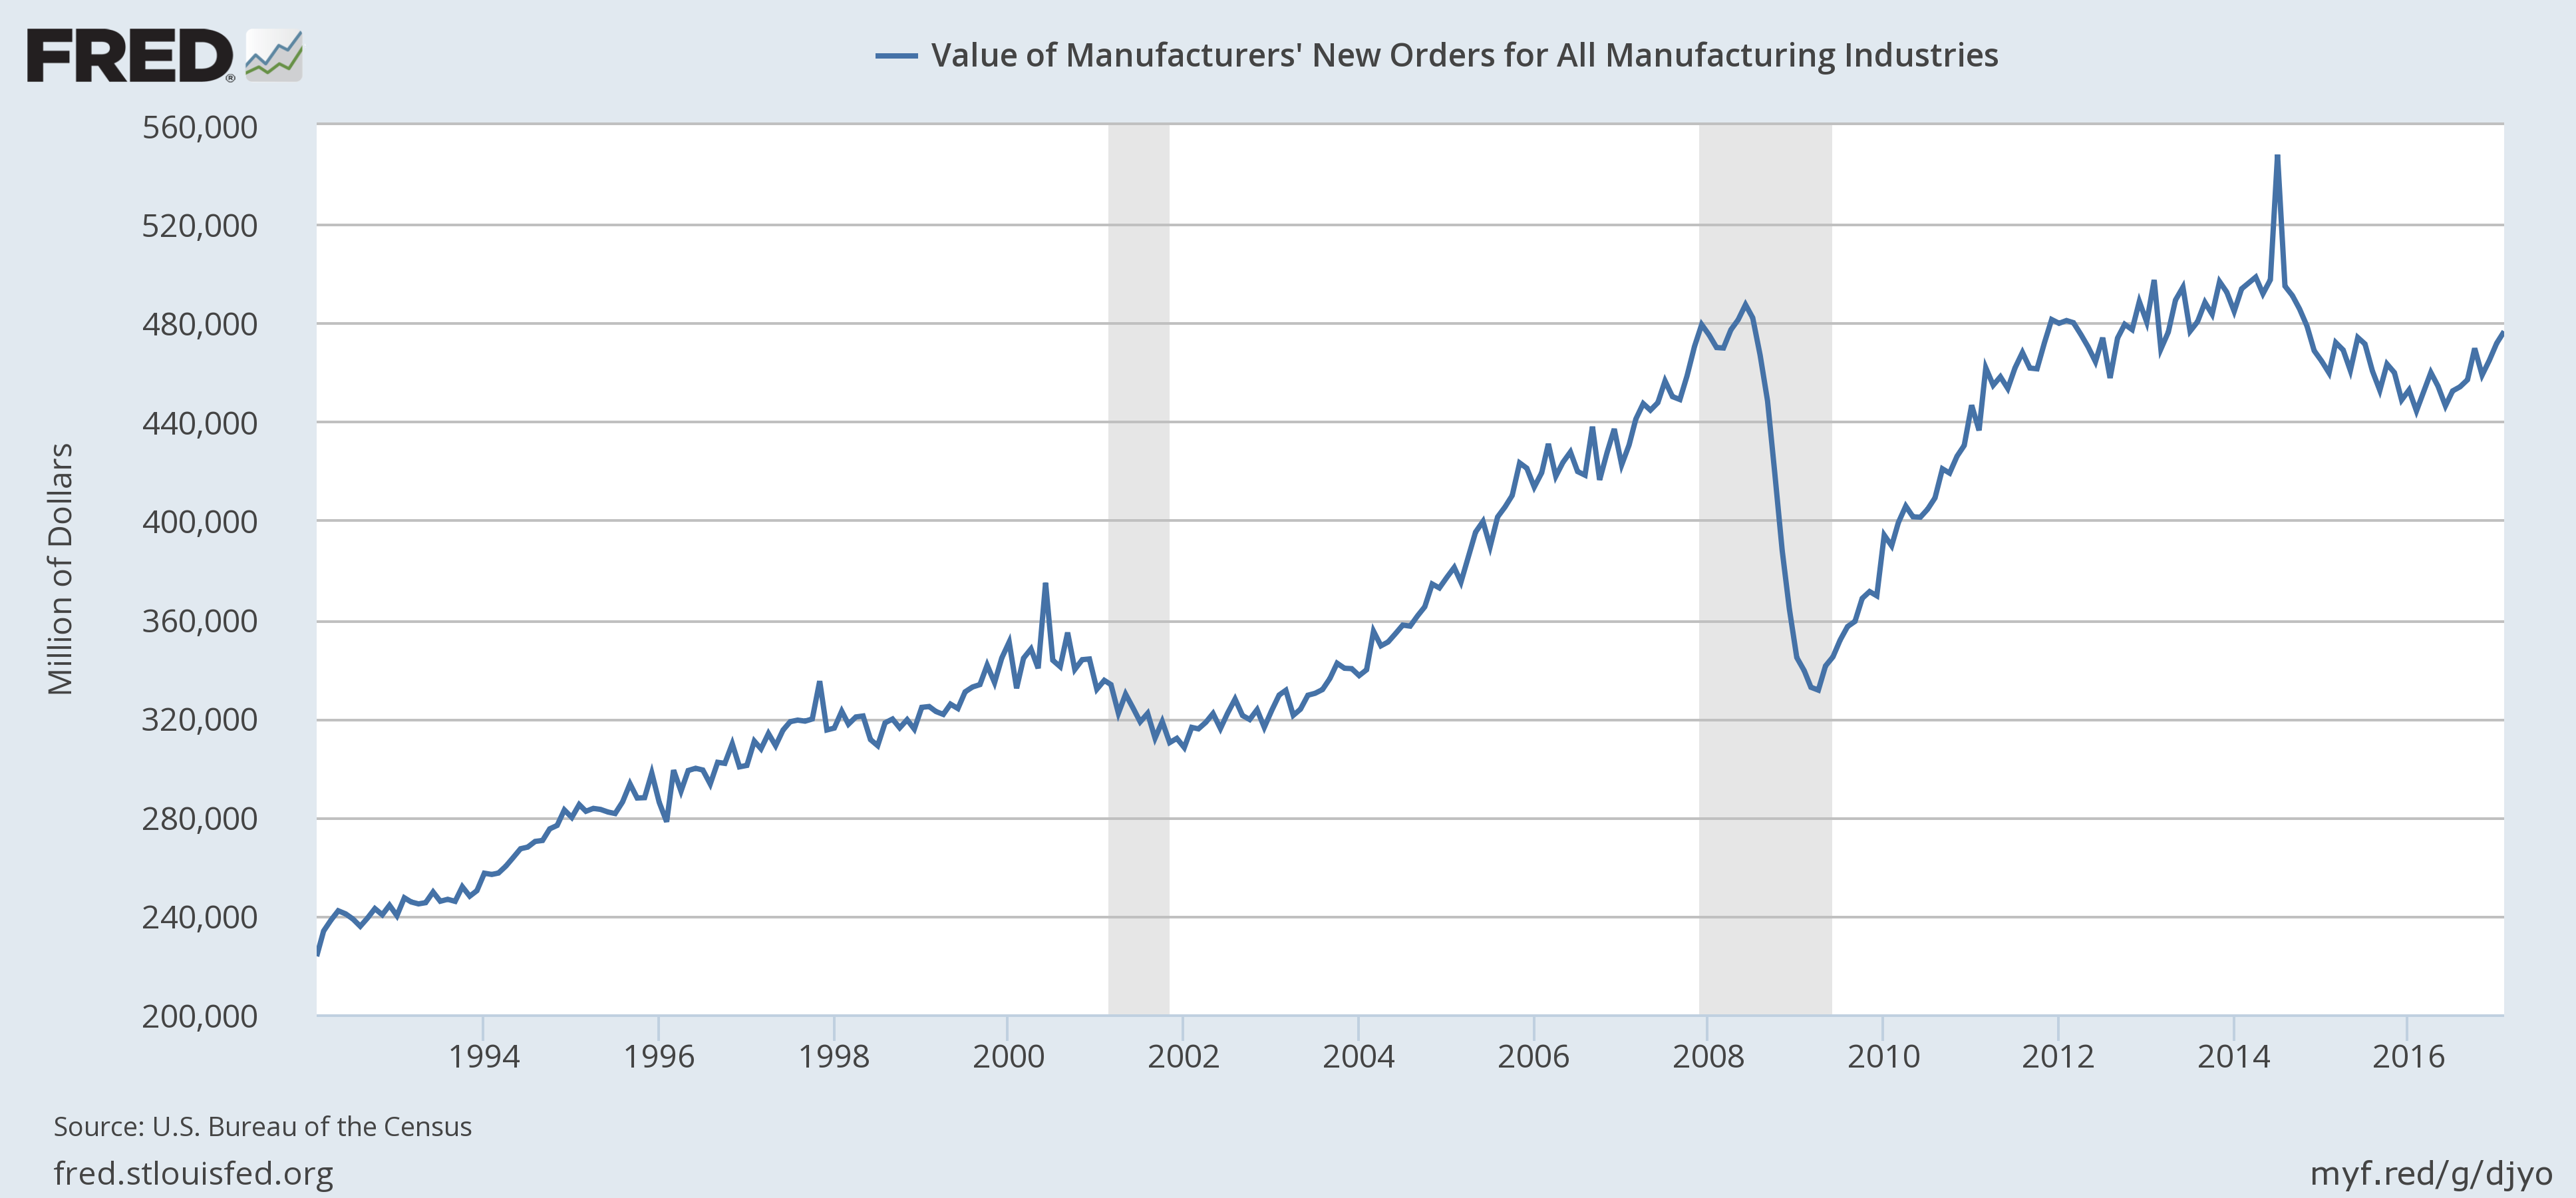 - Click to enlarge |
| Factory orders were indeed up from last month and last year; the short term trend is positive. Orders are also less than they were in December 2011 and December of 2007. Lost decade anyone? Okay, if you insist on being completely accurate, lost 9 years and 2 months?
Construction spending presents a similar picture: |
US Construction Spending, 1994 - 2016(see more posts on Construction Spending, )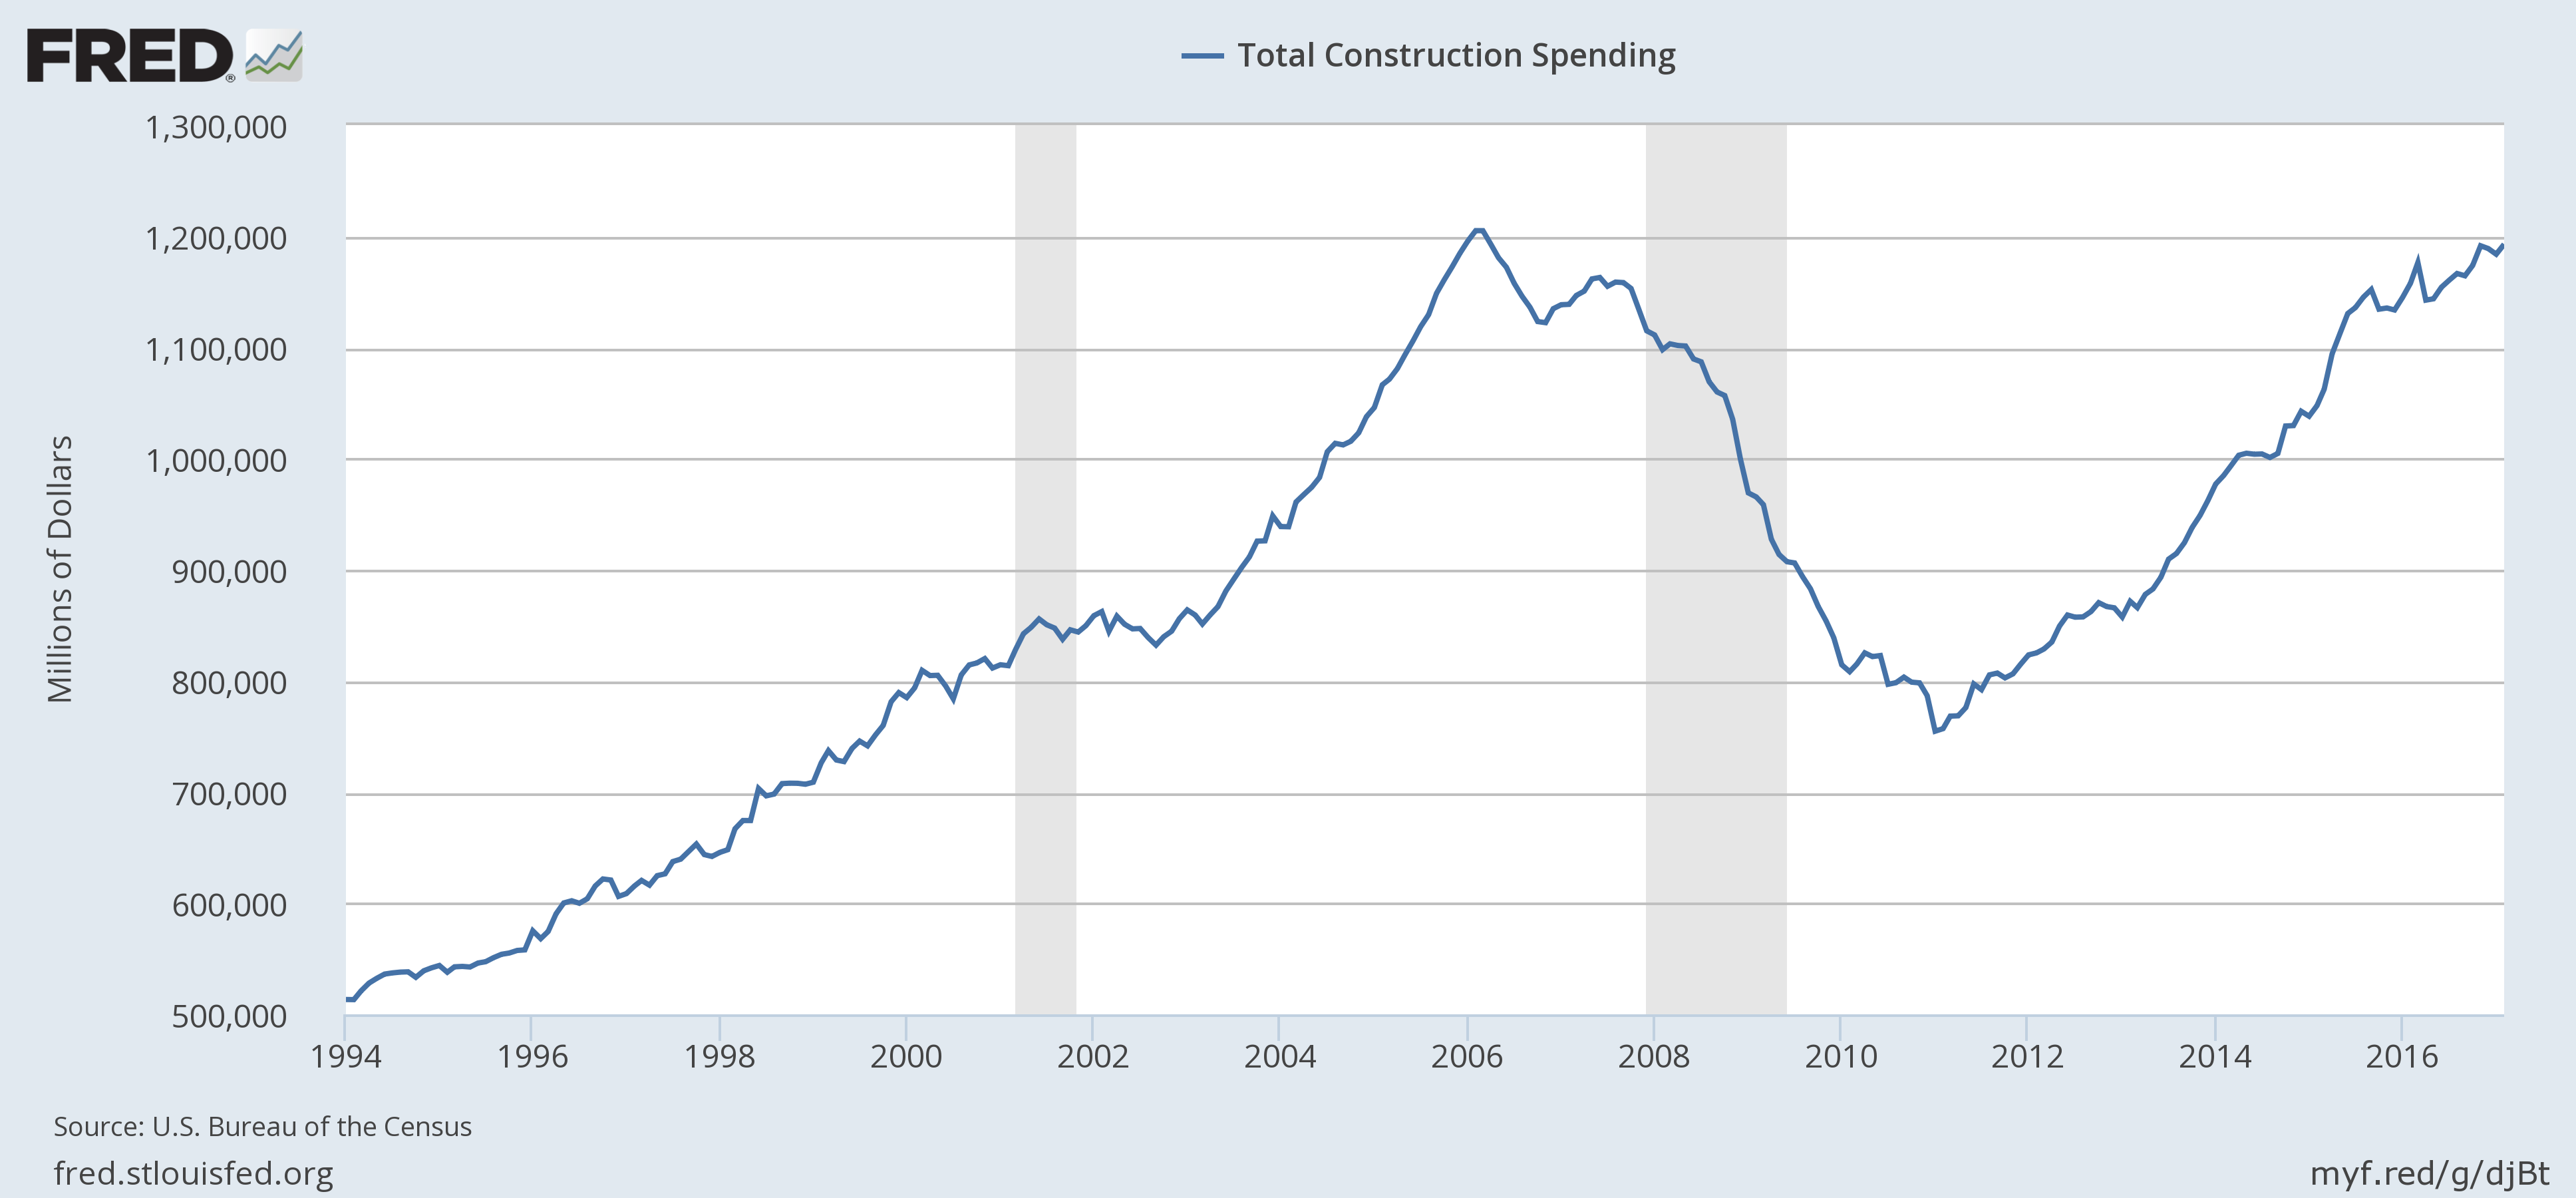 - Click to enlarge |
| Construction spending was up 0.8% month to month and the reading for January was revised higher (still a negative number). Year over year spending was up 3%. And yet spending is also just back to where it was in January 2006. I think we forget sometimes just how big a hole we dug for ourselves – or maybe more accurately dug by the Fed and our elected officials – in the 2008 wipeout.
Okay, one more and I’ll move on to other items. Corporate profits were reported in the last week of March as part of the revision to Q4 2016 GDP. Profits were up 22.3% from Q4 2015. For the full year of 2016, profits were up 4.3% from 2015. Sounds okay. Well, yes, except corporate profits are essentially unchanged since the first quarter of 2012. |
US Corporate Profits After Tax, 1950 - 2017(see more posts on U.S. Corporate Profits, )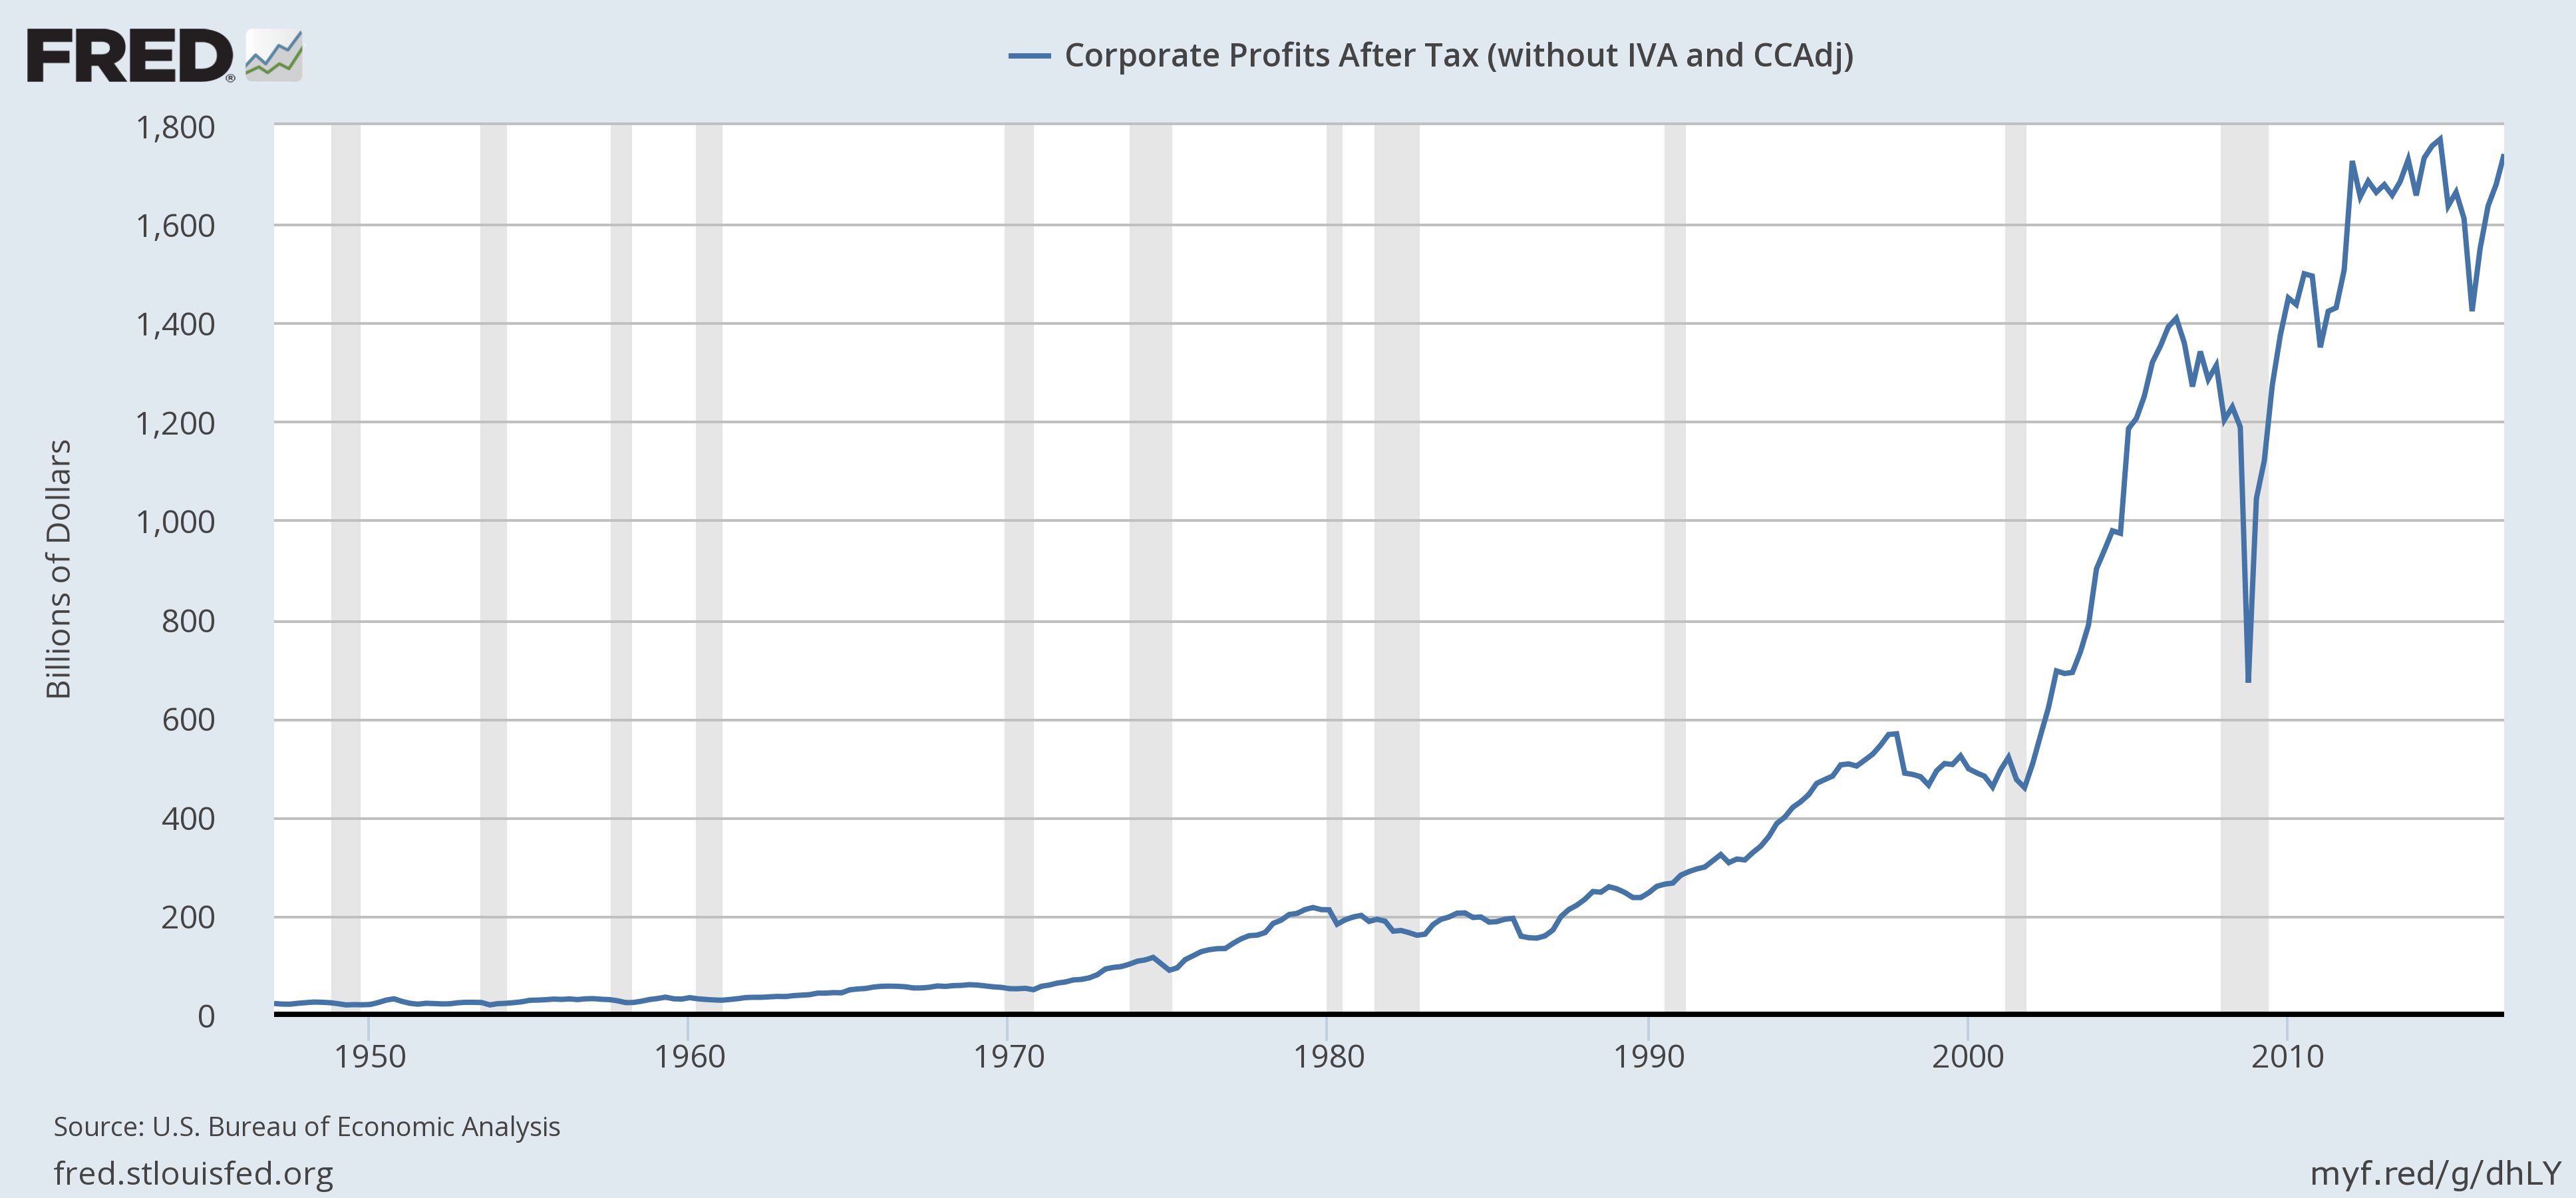 - Click to enlarge |
| All the data isn’t like this and what usually matters is the rate of change anyway, at least when it comes to markets. Personal income was reported up 0.4% for the month and 4.6% year over year. Those aren’t great numbers by any stretch of the imagination but it is solid and a big improvement over the low 3% numbers we were seeing last year. Better income isn’t translating yet into higher spending though as the personal consumption numbers show. Spending was up just 0.1% for the month and flat on an inflation adjusted basis. It’s a little better year over year at 4.81% but that’s a rate of change usually associated with the bottom of the growth range not the top.
We are seeing some improvements in the inventory picture though despite slow consumption. Inventory/Sales ratios have come down as inventory has been growing slower than sales. Frankly, when I look at the charts, it looks a lot like we are just coming out of recession, which in a way we are. The energy sector slowdown was rapid and severe but a quick recovery in oil prices has steadied the sector and the economy. Personally, I think it is a sad commentary on the state of our economy when growth is so dependent on the price of oil but this is the economy we’ve become. The question from here though is whether the inventory improvement is just beginning or just taking a pause. |
Wholesale Inventories, 1992 - 2016(see more posts on Wholesale Inventories, ) - Click to enlarge |
| We did get two pretty high profile weak data points in the last two weeks. The employment report was an obvious disappointment although mitigated somewhat by the idea that weather played a role. I’m not so sure about that but frankly whether the number was +98,000 or + 250,000 matters a lot less than you might think. History says the real difference maker is the + or -, not the size of the change. The other disappointing number was auto sales which appear to have peaked for this cycle. Cars are selling at an annualized rate of about 16.5 million, down from a peak of nearly 18.5 million. That might sound like a big change and it is but I would also point out that in previous cycles, sales tend to peak and then go sideways for the remainder of the expansion. So, even if this is a lousy number – and it is – it doesn’t mean anything imminent.
There wasn’t a lot of change in our market based economic indicators. The yield curve flattened by about 4 basis points continuing a trend that started in mid-December. As I’ve said many times, the yield curve isn’t telling us anything unusual at this point. In the past the curve flattened completely before recession and we aren’t close to that. But we don’t know if that will happen in this cycle with short term rates so low. Based on history though, this indicator has been and remains neutral. |
US Treasuries, 1988 - 2016(see more posts on U.S. Treasuries, )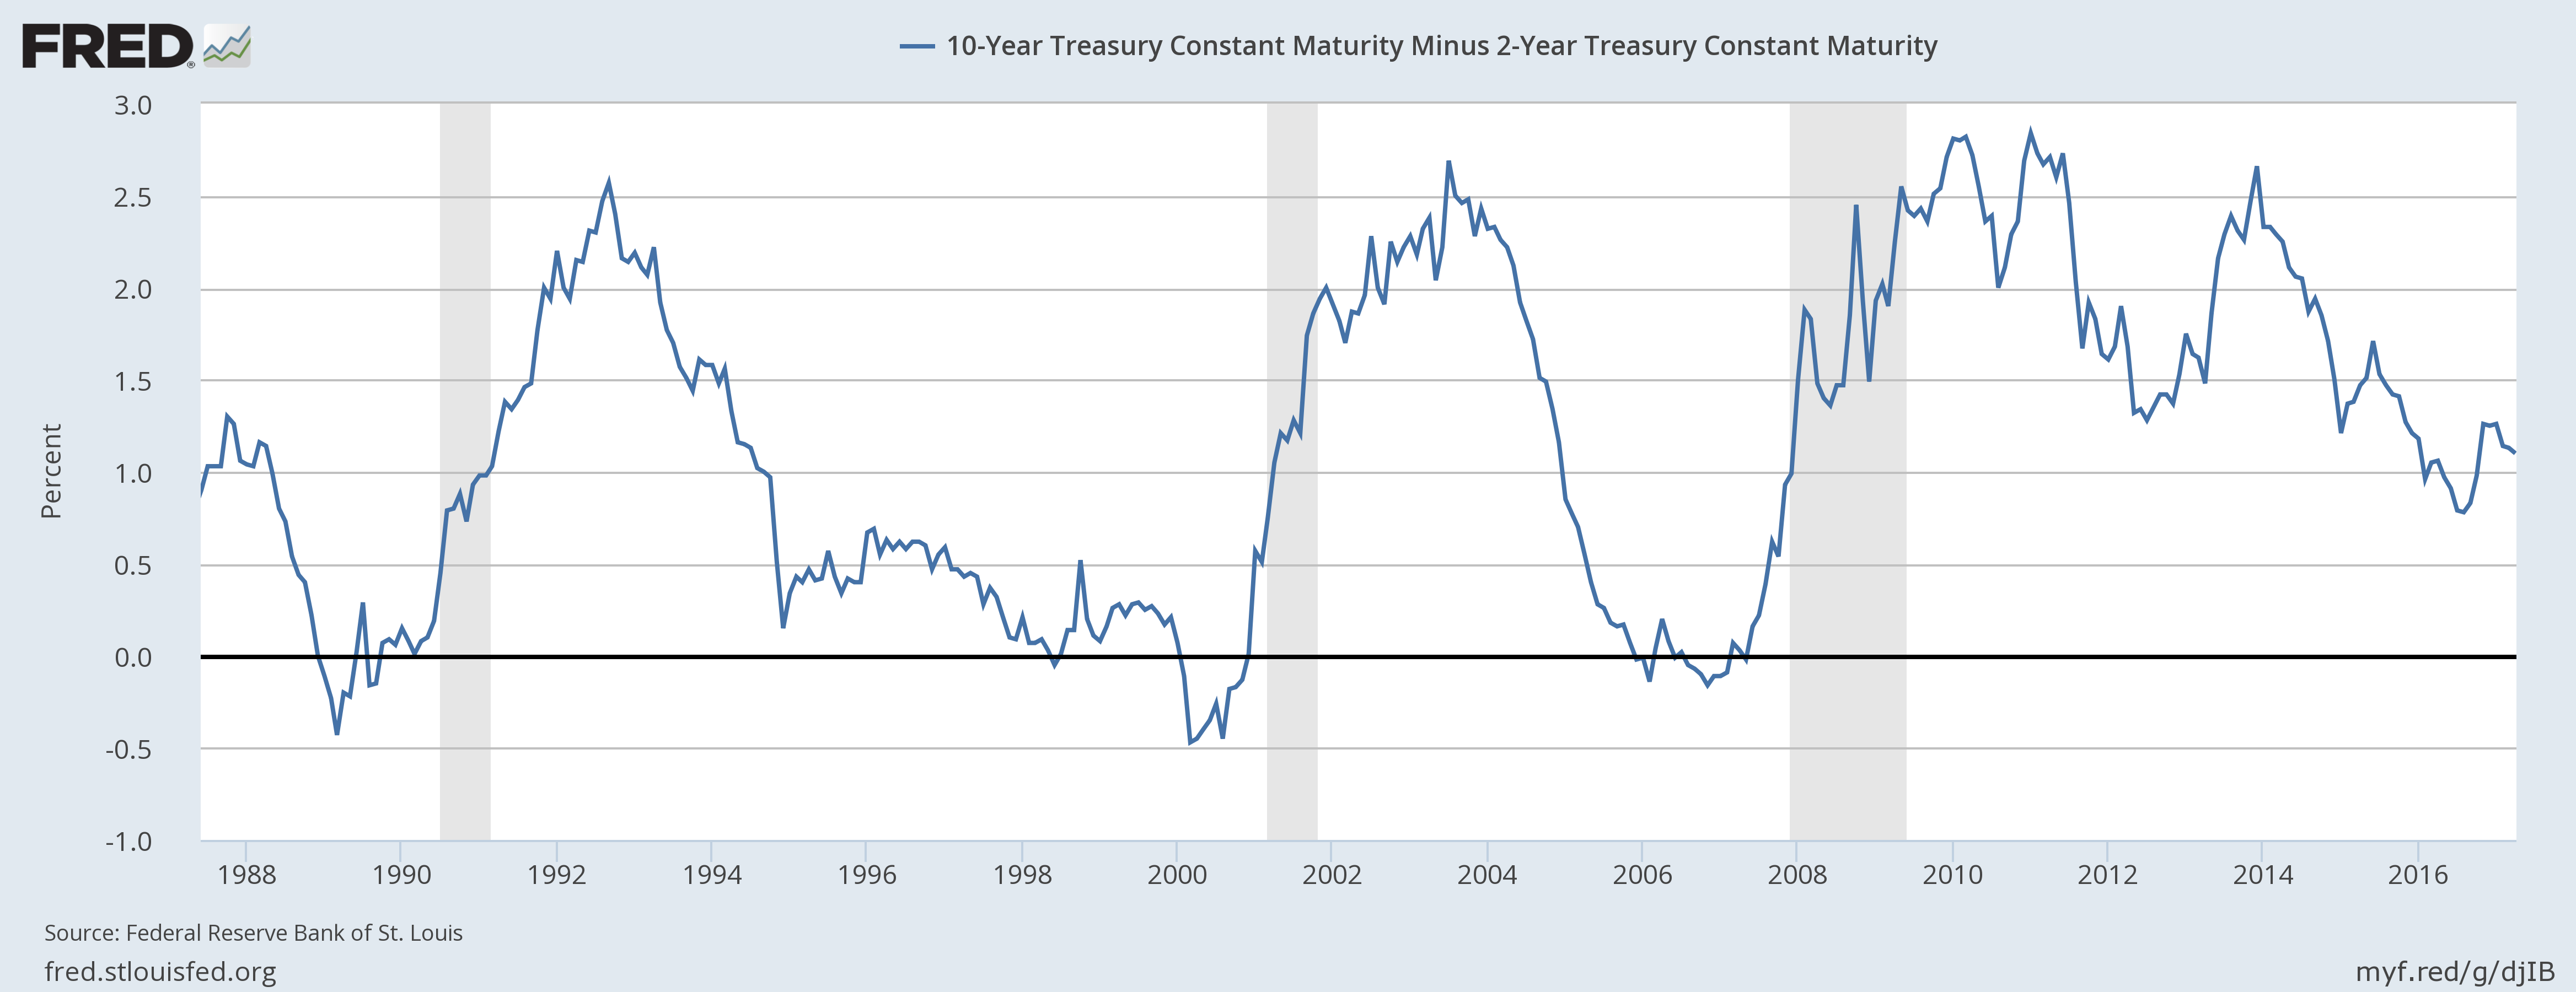 - Click to enlarge |
| 10 Year TIPS rates – real interest rates – fell about 3 basis points since the last update. All that green up there isn’t translating into higher real rates (real growth expectations). |
US Treasuries, July 2012 - January 2017(see more posts on U.S. Treasuries, ) - Click to enlarge |
| The nominal 10 year note fell about 6 basis points so inflation expectations and nominal growth expectations fell: |
US Treasuries, January 2007 - 2017(see more posts on U.S. Treasuries, )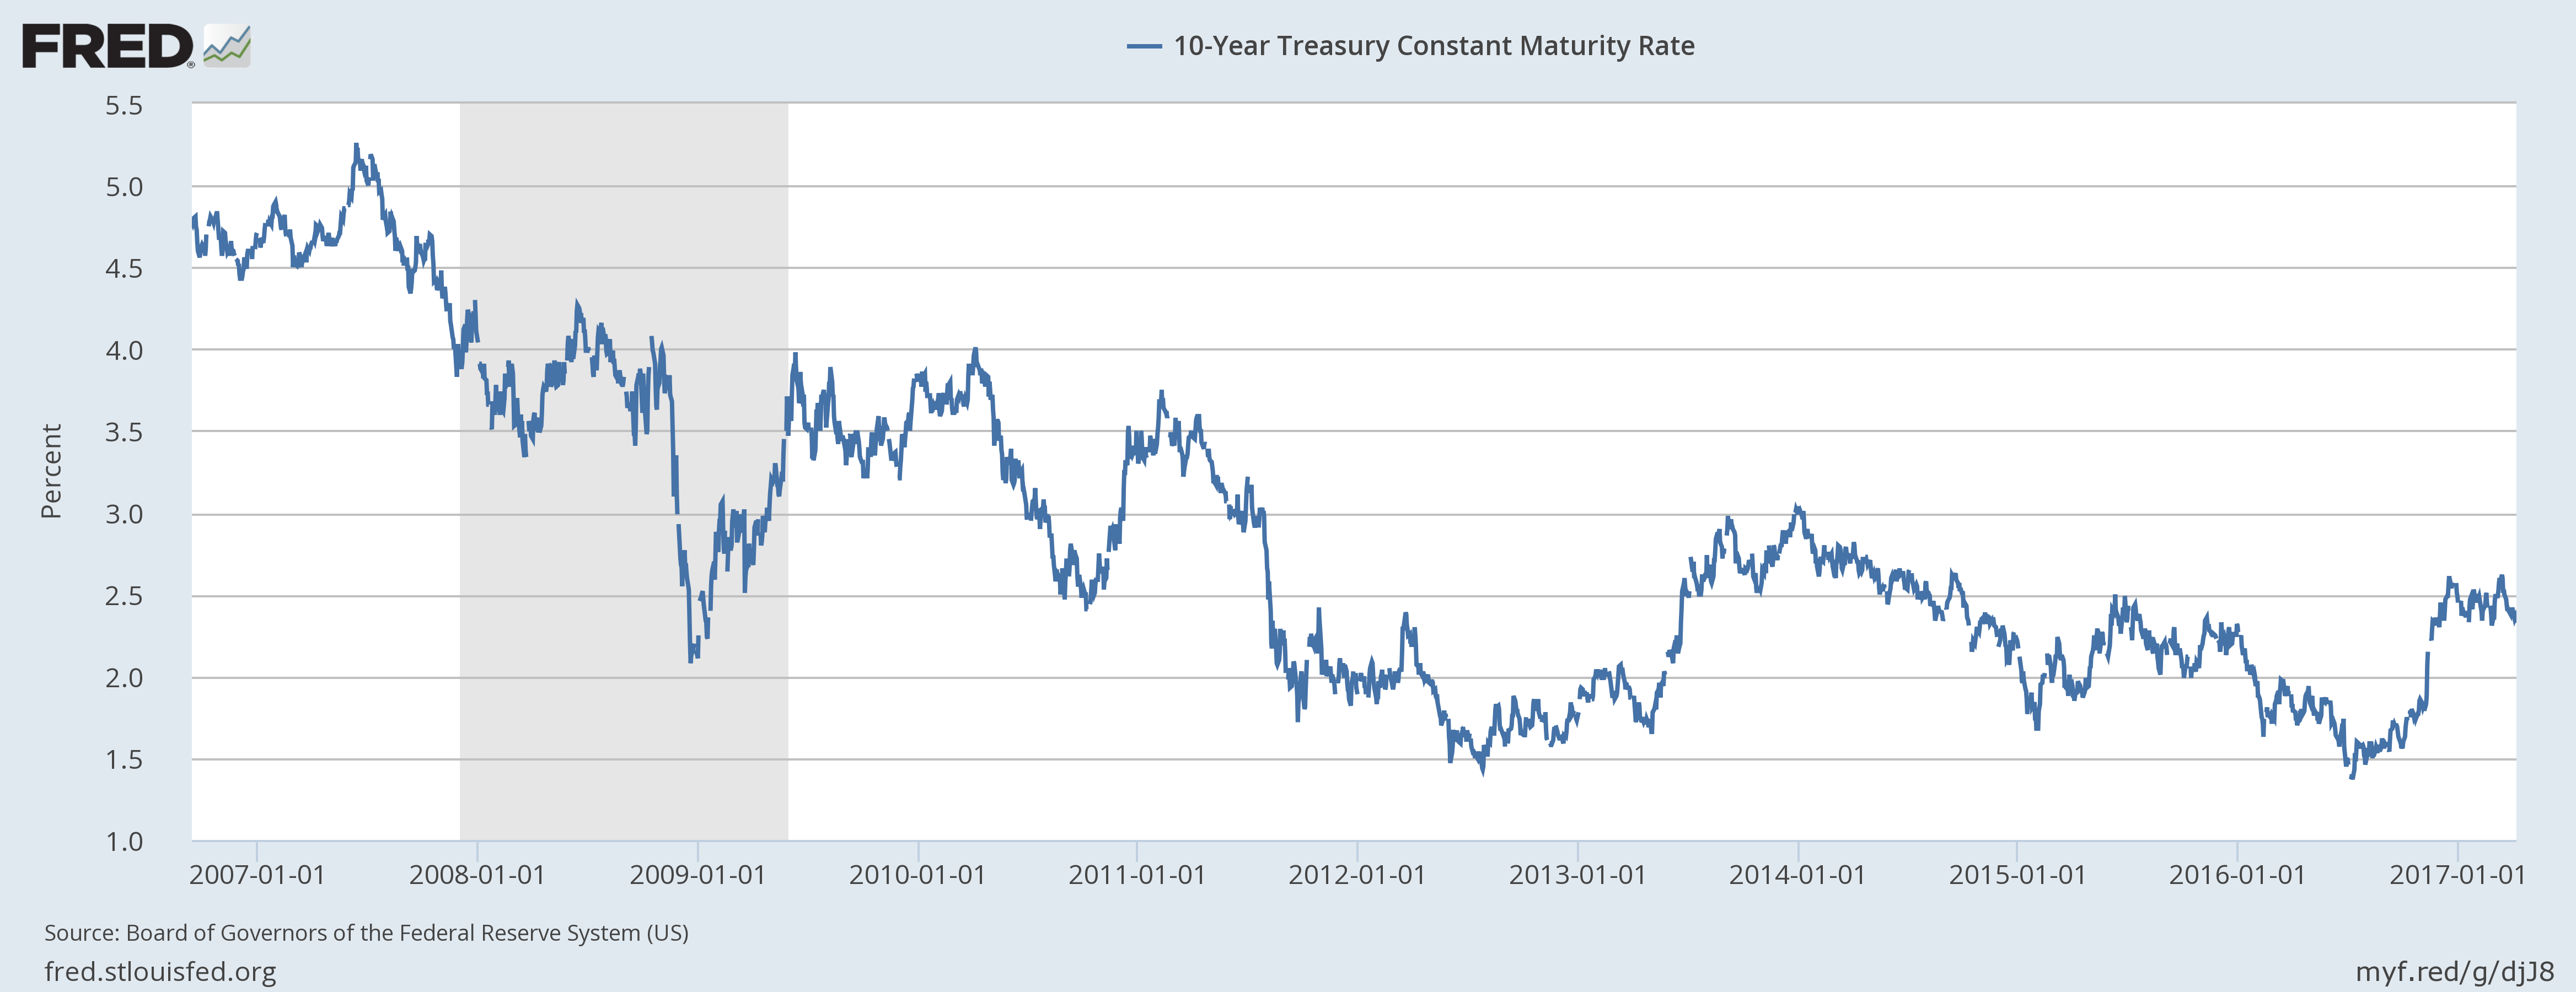 - Click to enlarge |
| Credit spreads actually fell by 21 basis points as oil prices moved higher since the last update. Junk investors might want to stop basing all their buy/sell decisions on the price of oil though. Bankruptcies are picking up but only part of that is energy. Retail is becoming the bigger problem, partly due to Amazon and party due to just lousy consumption growth. For now though spreads are highly correlated with oil prices: |
BofA Merrill Lynch Fund, July 2012 - January 2017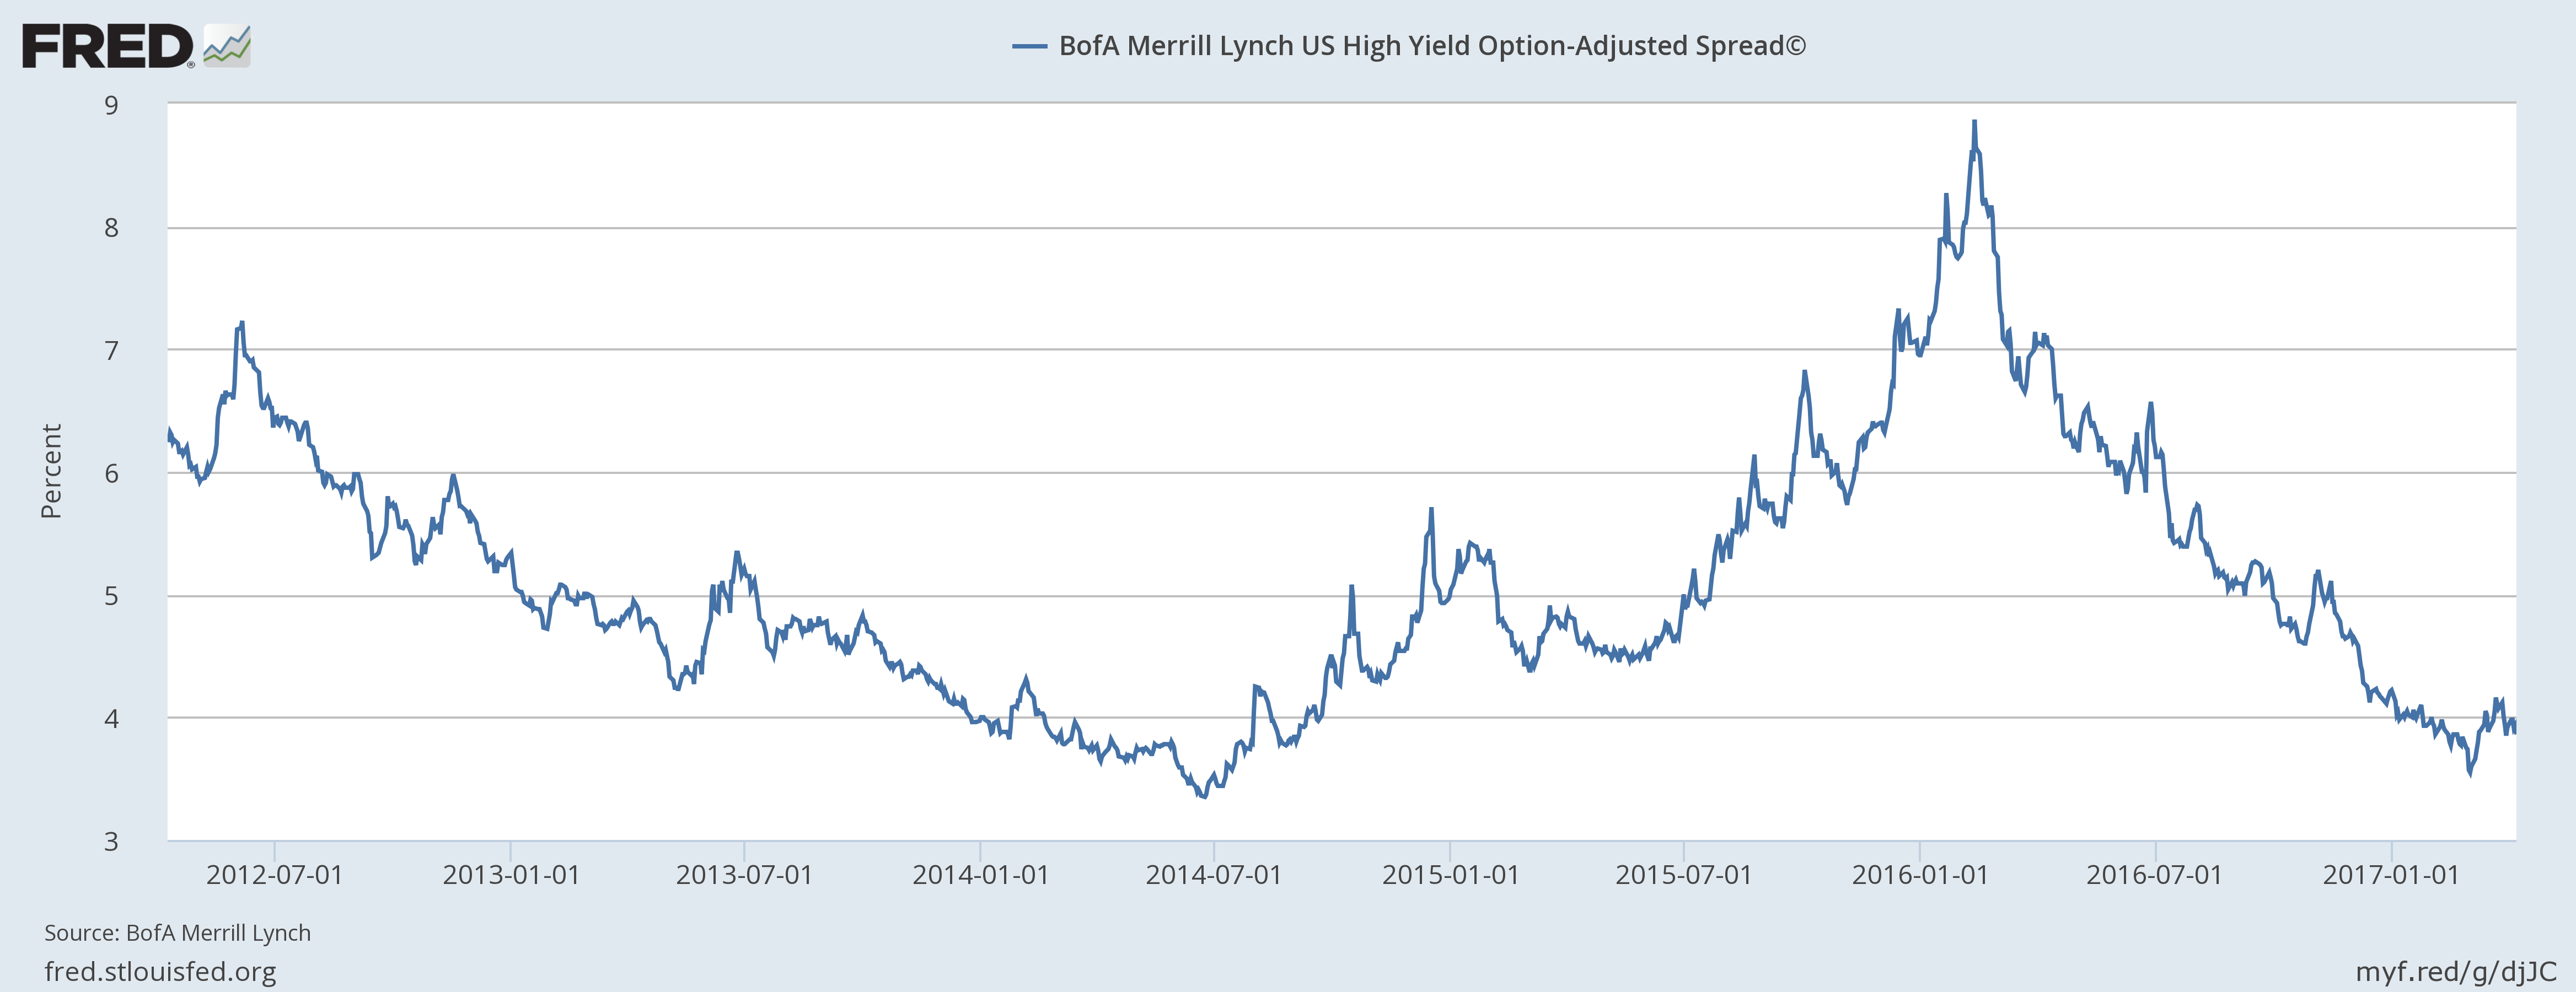 - Click to enlarge |
| The US dollar recovered a bit from its latest selloff but only back up to the developing downtrend line. The topping process continues: |
US Dollar Index, July 2016 - April 2017(see more posts on U.S. Dollar Index, )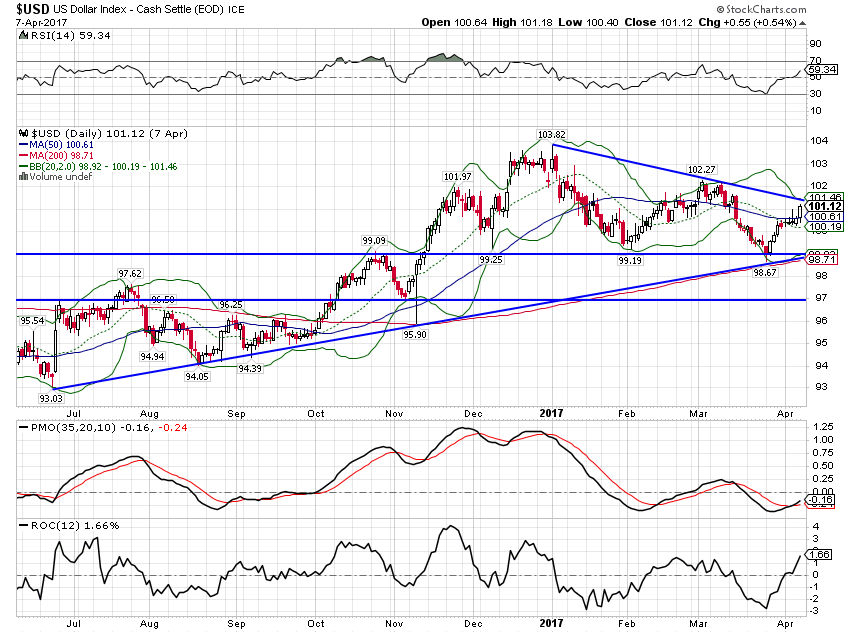 - Click to enlarge |
| The dollar rally did not impress the gold market. Prices flatlined since the last update.
There has been a general improvement in the economic data over the last six months but it needs to be put into context and perspective. The slowdown of the last two plus years due to the drop in oil prices is ending but the long term stagnation hasn’t changed. It could be that this upturn of the last six months turns into something more, something better than the last 8 years since the crisis. But frankly, I’m in a prove it to me mood. Economic policy hasn’t changed and sentiment isn’t enough, by itself, to change the growth path we’ve been on. The Trump administration came in with a strategy that excited companies and consumers. What they didn’t have and apparently still don’t is a tactical plan for accomplishing their strategic goals. Absent a tactical plan, the administration’s proposed changes are more an impediment than a boost. Companies are stuck in limbo, waiting to see if their investments can be expensed or must be depreciated. They are stuck wondering if the interest costs will be a deductible expense. Not insignificant concerns and ones that can’t be resolved as long as corporate tax reform is an open debate. Individuals are wondering what will happen to their health insurance and whether any of their deductions will be reduced or eliminated. Again, big concerns and ones that need to be resolved soon. If the Trump administration continues to flounder, so will the US economy. |
Gold Daily, September 2016 - April 2017(see more posts on Gold, )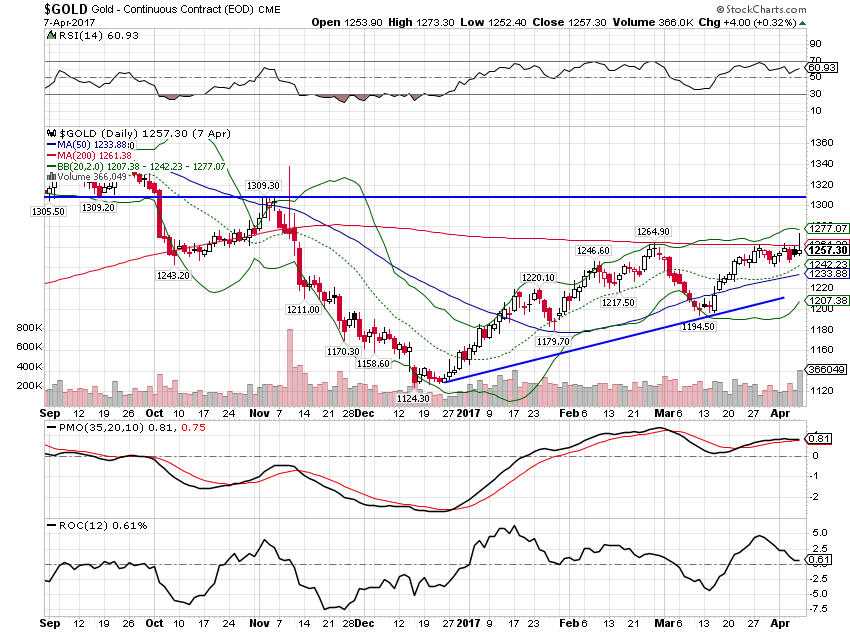 - Click to enlarge |
“Wealth preservation and accumulation through thoughtful investing.”
For information on Alhambra Investment Partners’ money management services and global portfolio approach to capital preservation, Joe Calhoun can be reached at: [email protected] or 786-249-3773. You can also book an appointment using our contact form.
This material has been distributed for informational purposes only. It is the opinion of the author and should not be considered as investment advice or a recommendation of any particular security, strategy, or investment product. Investments involve risk and you can lose money. Past investing and economic performance is not indicative of future performance. Alhambra Investment Partners, LLC expressly disclaims all liability in respect to actions taken based on all of the information in this writing. If an investor does not understand the risks associated with certain securities, he/she should seek the advice of an independent adviser.
Tags: Alhambra Research,Bi-Weekly Economic Review,Bonds,commodities,Construction Spending,corporate profits,credit spreads,currencies,dollar,economic data,economy,Gold,Markets,new orders,newslettersent,TIPS,U.S. Corporate Profits,U.S. Dollar Index,U.S. Treasuries,Wholesale Inventories,Yield Curve


