


Keith Weiner
My articles My offerMy siteAbout meMy videosMy books
Follow on:LinkedINTwitterSeeking AlphaFacebookAmazonGoogle +
See the introduction and the video for the terms gold basis, co-basis, backwardation and contango.
Bitcoin ManiaThe price of gold has been rising, but perhaps not enough to suit the hot money. Meanwhile, the price of Bitcoin has shot up even faster. From $412, one year ago, to $1290 on Friday, it has gained over 200% (and, unlike gold, we can say that Bitcoin went up — it’s a speculative asset that goes up and down with no particular limit). |
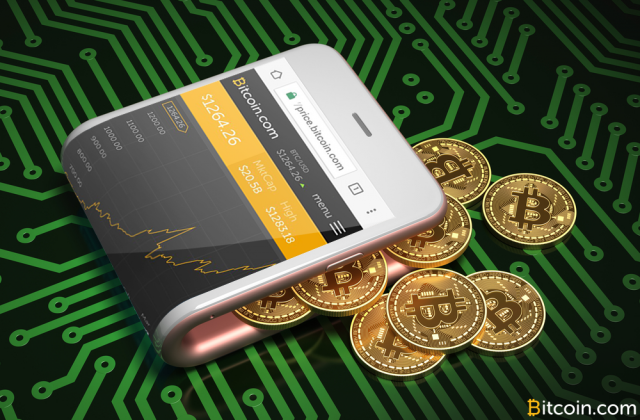 Bitcoins are a lot less tangible than this picture implies, but they are getting a lot of love recently [PT] - Click to enlarge |
| Compared to the price action in Bitcoin, gold seems boring. While this is a virtue for gold to be used as money (and a vice for Bitcoin), it does tend to attract those who just want to get into the hottest casino du jour.
Perhaps predictably, we saw an ad from a gold bullion dealer. This well-known dealer is comparing gold to Bitcoin, and urging customers to stick with gold because of gold’s potential for price appreciation. We would not recommend relying on this argument. Whatever the merits of gold may be, going up faster than Bitcoin is not among them. We spotted another ad today from a mainstream financial adviser. The ad urged clients not to buy gold. This firm should have little need to worry. Stocks have been in a long, long, endless, forever, never-to-end bull market. Gold is not doing anything exciting now. $1234? “WhatEVAH (roll eyes)!” Stocks, well, the prices just keep on going up. Like we said, nothing whatsoever to worry about. Other than declining dividend yields. There’s more than enough irony to go around. Speaking of dividend yield, that leads us to an idea. Readers know that we like to compare the yield of one investment to another. This is why we quote the basis as an annualized percentage. You can compare basis to LIBOR easily. And also stocks. Or anything else. For example, the basis for December — a maturity of well under a year— is 1.2%. The dividend yield of the S&P stocks is just 1.9%. For that extra 70bps, you are taking a number of known risks, and some unknown risks too. It is worth noting that the yield on the 10-year Treasury is up to 2.5%. Yes, that’s right, you are paid less for the risk of investing in big corporations than you are for holding the risk free asset. |
Bitcoin, Daily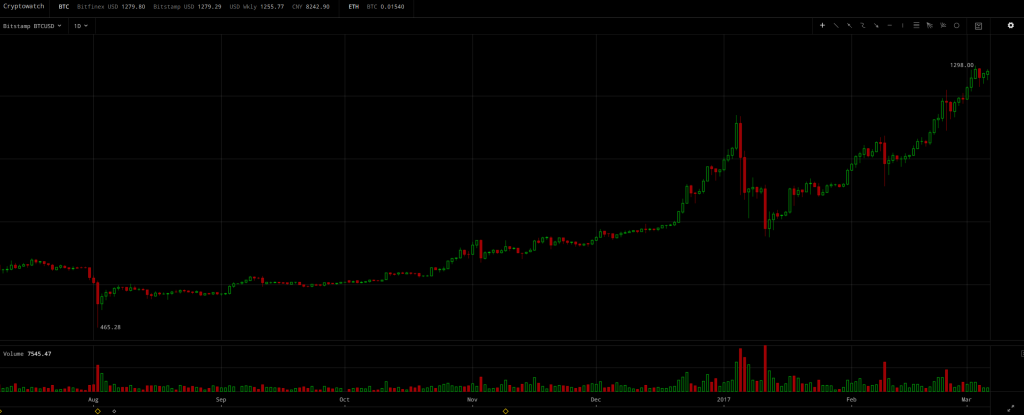 Bitcoin has been on a tear lately – the same cannot be said of gold at the moment [PT] – click to enlarge. - Click to enlarge |
| Of course, the Treasury bond is not really risk free. But in any case, if the Treasury defaults then it’s safe to assume most corporations will be destroyed, if not our whole civilization. |
US Treasury Yield Index, April 2007 - 2017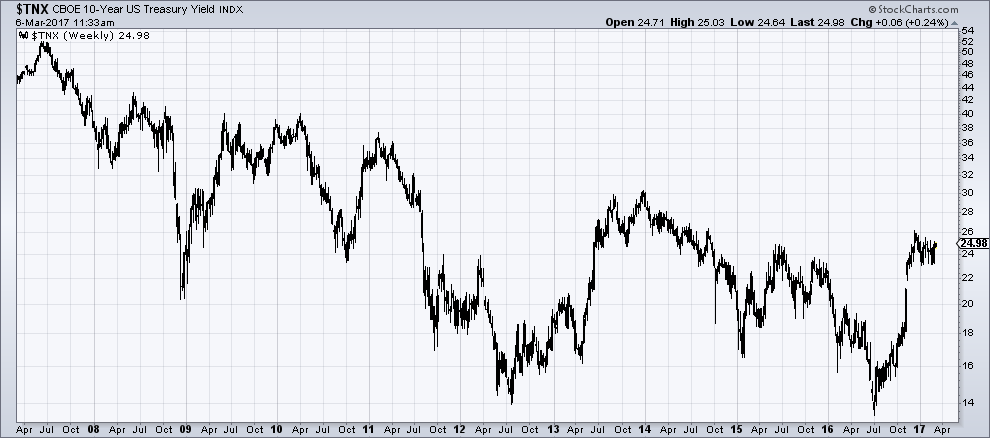 The “risk-free” 10 year treasury note yields a lot more than last year, but while 2.5% is not exactly exciting, it is still more than the stocks in the S&P 500 Index are paying out in dividends. It doesn’t look like anyone is getting proper compensation for the risks involved [PT] - Click to enlarge |
A Shortlist of MythsWe have heard the mainstream theory so many times, our heads are hurting. Here are the myths: the Chinese are selling, inflation is coming, and the economy is picking up. China is selling. The Chinese people are selling the yuan to buy dollars – when they can get through the increasingly-strict capital controls. The People’s Bank of China takes the other side of the trade — selling dollars and buying yuan — to keep the yuan from collapsing. When a foreign central bank holds dollars, it does not hold paper notes. Nor does it deposit them in a commercial bank. It holds Treasury bonds. Its sales of Treasuries may look scary, but that is just what is seen. The unseen is that the Chinese people are buying dollars. Those dollars come back to the Treasury market one way or the other. |
USD/CNY Weekly Onshore Yuan, weekly. This is the USDCNY notation, which shows how many yuan one has to pay for one US dollar, i.e., a rising trend on the chart denotes a weakening yuan [PT] - Click to enlarge |
| Inflation is coming. The Fed is printing, the quantity of money is going up, there will be demand-pull, etc. Well, if that were true then the last place you would want to be is in an asset the price of which is set by the net present value of its future free cash flows. Or at least the price should be. If you think that stock prices have to rise in inflationary periods, look at what happened in the 1970s.
The economy is picking up. What can we say? There are two views on this. One has seen (or looked for) green shoots and nascent recoveries since the crisis. The other has seen rising asset prices, and with that a small wealth effect. We will not opine about Trump and the future of the economy here. We just wish to note that junk bonds have not sold off the way Treasuries have. Junk bonds have hardly sold off at all. Quite the opposite. They have been massively bid up (i.e. yield has been crushed). We submit for your consideration that if inflation was coming and/or the economy was picking up, you would do even worse in junk bonds than in S&P stocks. The 10-year Treasury hit its low yield (so far) of 1.3% in July. Since then, it has been a wild ride mostly up to 2.6% in December. Since then it’s been choppy but falling (i.e. prices rising a bit). July also happens to be when the yield on the Swiss 10-year government bond began rising. It made a low of -0.6% (yes, negative). Since then, the yield has gone up (i.e. bond price has gone down) to near zero in December. It is currently at -0.1%. In Japan, the same occurred. Low yield on the 10-year government bond in July was -0.3%. The high was hit in December. Still elevated now, but off the December high. It’s almost as if government bond yields around the world were moved by the same drivers, or even connected by some kind of arbitrage… Whatever the cause of this worldwide selloff of government bonds may be, it is not selling by China. It is not inflation. It is not expectations that the economy will take off under Trump. Maybe it’s just traders looking at price charts, buying because stocks are going up? |
US High Yields Effective Yield and CCC or Below Effective Yield, January 2011 - 2017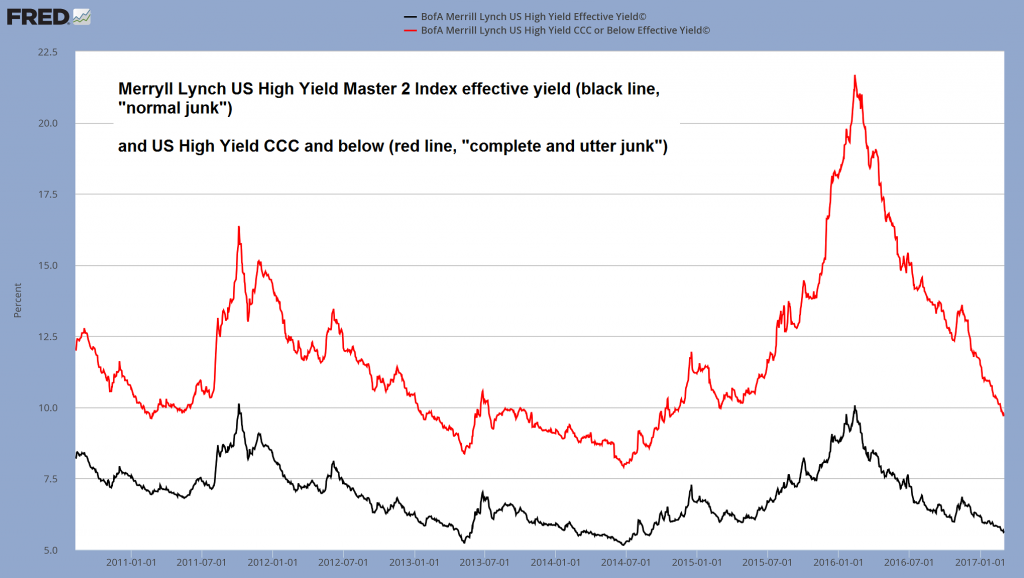 Happy days are here again! Apparently there is currently practically no risk whatsoever in holding junk bonds. Especially the very worst ones are doing exceptionally well. Who are we to argue with “millions of well-informed investors” – they are always right, aren’t they? [PT] - Click to enlarge |
Precious Metals – Fundamental DevelopmentsThis week, the prices of the metals dropped. As always, the question is what happened to the fundamentals? Below, we will show the only true picture of the gold and silver supply and demand. But first, the price and ratio charts. |
Gold and Silver Prices(see more posts on gold price, silver price, )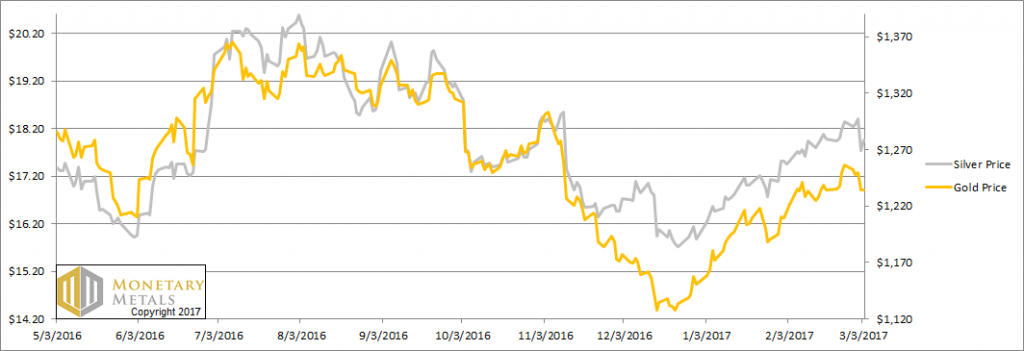 Prices of gold and silver - Click to enlarge |
Gold:Silver RatioNext, this is a graph of the gold price measured in silver, otherwise known as the gold to silver ratio. It moved sideways again this week.
|
Gold:Silver Ratio(see more posts on gold silver ratio, )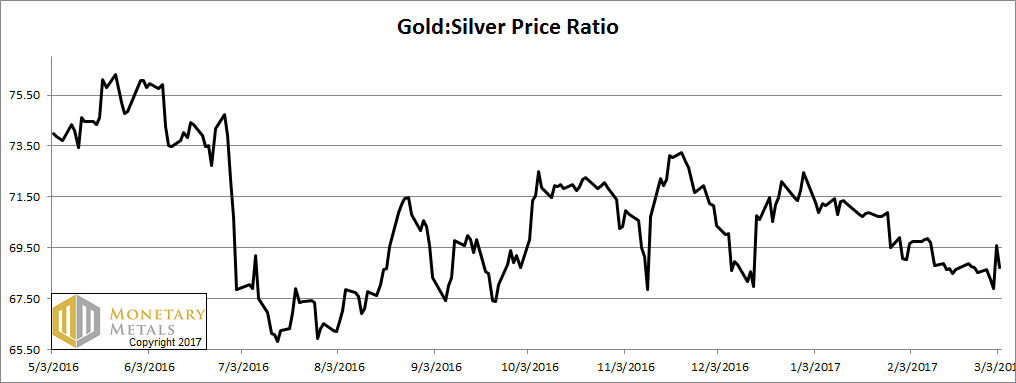 Gold-silver ratio - Click to enlarge |
Gold Basis and Co-basis and the Dollar PriceHere is the gold graph. This week, our old friend returned. He is the correlation between the price of the gold (i.e., the inverse of the price of gold in dollar terms) and the co-basis (i.e., our scarcity indicator). They had been moving together. This week, they met up for old time’s sake. The dollar is up from 24.75mg gold to 25.20mg. And the co-basis is up from -0.41% to -0.16%. At least in the April contract, which is rapidly approaching First Notice Day, and is already under downward pressure. For farther contracts, the co-basis is up, but not that much. Our calculated fundamental price dipped twenty bucks. It is still $150 above the market price. |
Gold Basis and Co-basis and the Dollar Price(see more posts on dollar price, gold basis, Gold co-basis, )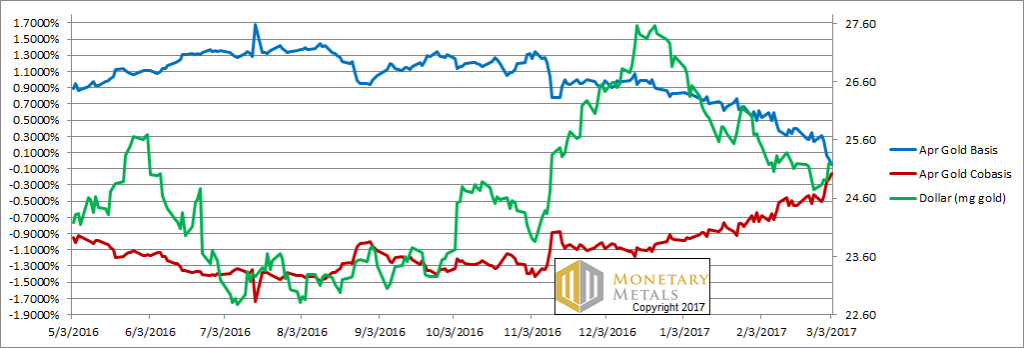 Gold basis and co-basis and the dollar price - Click to enlarge |
Silver Basis and Co-basis and the Dollar PriceNow let’s look at silver. The co-basis in silver move up big-time as well. The silver fundamental price also fell, about fifteen cents. |
Silver Basis and Co-basis and the Dollar Price(see more posts on dollar price, silver basis, Silver co-basis, )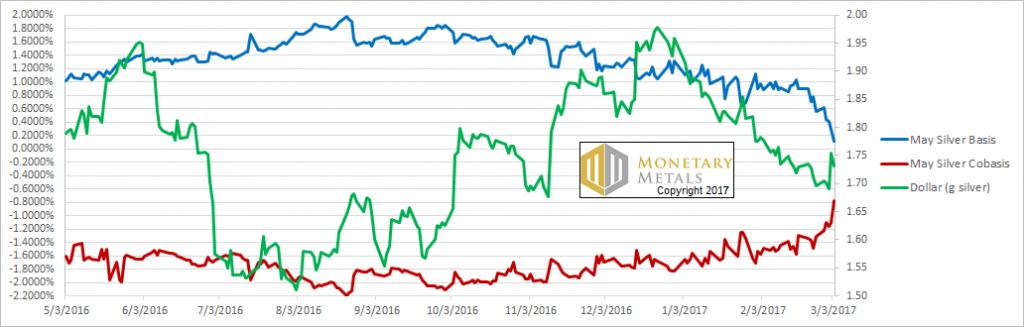 Silver basis and co-basis and the dollar price - Click to enlarge |
Charts by: Cryptowatch, StockCharts, BigCharts, St. Louis Federal Reserve Research, Monetary Metals
Chart and image captions by PT where indicated
Full story here Are you the author?
Tags: Chart Update,dollar price,Gold,Gold and silver prices,gold basis,Gold co-basis,gold price,gold silver ratio,newslettersent,Precious Metals,silver,silver basis,Silver co-basis,silver price,Virtual Currencies


