Jeffrey P. Snider
My articles My offerMy siteAbout meMy videosMy books
Follow on:LinkedINTwitterSeeking Alpha
There has always been something like Newton’s third law observed in the business cycles of the US and other developed economies. In what is, or was, essentially symmetry, there had been until 2008 considerable correlation between the size, scope, and speed of any recovery and its antecedent downturn, or even slowdown. The relationship was so striking that it moved Milton Friedman to finally publish in 1993 his plucking model theory he had first written in 1964.
This post-crisis period of the whole of the 2010’s (so far) has been primarily notable for its apparent lack of symmetry at every turn. Whether in the initial stages after the downward force of the Great “Recession” had finally dissipated, or what followed the slowdown in 2012 (far less of an improvement or upturn as was made out to be), we may be observing for the third time asymmetry.
| Global manufacturing and industry, in particular, experienced the worst of the “rising dollar” period. For much of it, there was a steady if shallow two or two –plus year contraction. US Industrial Production declined for fifteen months starting in September 2015, the month after the eruption of “global turmoil” rudely introduced by the misunderstood (still) Chinese yuan “devaluation” (“dollar” run). Over the past three months, including the latest figures released today for February 2017, IP has returned to the plus side.
Those positive gains, year-over-year, have not been as you would expect governed by pre-crisis behavior, each of the three conspicuously small and unenthusiastic – December just +0.7%, +0.2% January, and +0.3% February. In truth, only December could be classified as better than flat or zero growth, and just barely. |
Industrial Production YoY, Jun 1995 - Jan 2017(see more posts on U.S. Industrial Production, )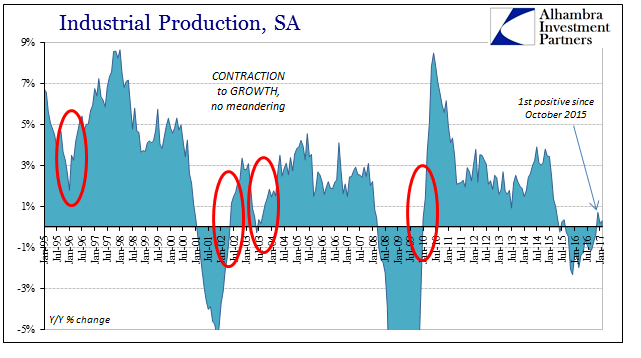 - Click to enlarge |
| There is a small chance this is a statistical artifact of whatever outdated benchmark that could be revealed next month with the annual revisions. Those produced last year found a significantly worse overall contraction and slightly more negative slope (the downturn started in September 2015 rather than November as originally thought), meaning the updated estimates this time could produce a more vigorous upward response. I am skeptical, however, because the underlying data suggests still more weakness as opposed to the possibility of less. |
Capacity Utilization Jan 2011 - 2017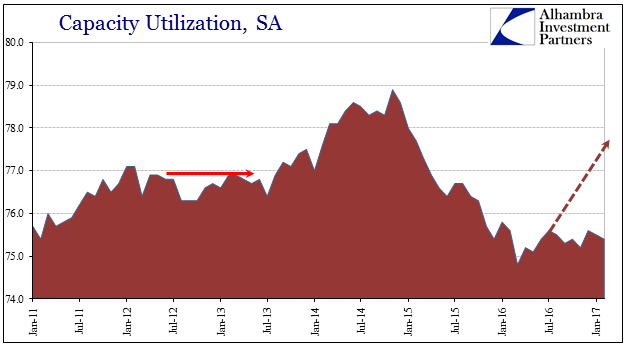 - Click to enlarge |
Industrial Production Index Values, Jan 2006 - Jan 2017 - Click to enlarge |
|
| The current series is not being dragged lower any more by the oil sector. In the mining segment, crude oil production in February 2017 was just about even with estimated production in February 2016. The trend for the oil industry unlike overall US industry is actually symmetrical to this point (will it continue with sub-$50 oil?). |
Industrial Production Crude Oil Mining, Jan 2006 - 2017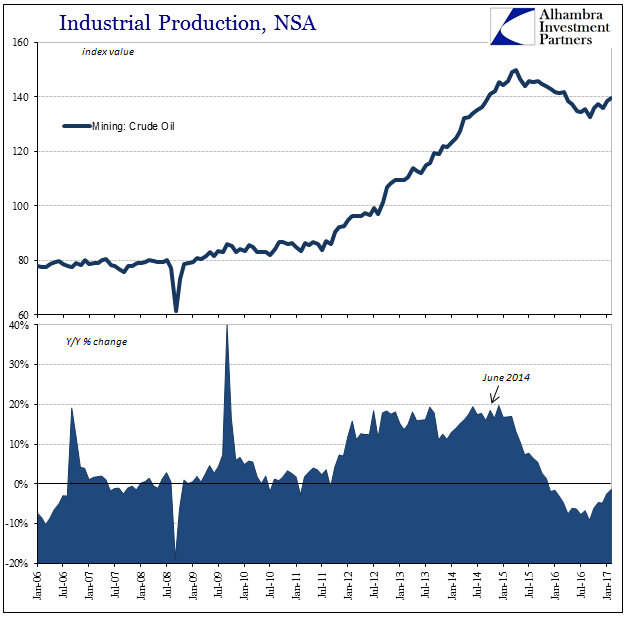 - Click to enlarge |
| That means the lack of a rebound is not due to energy, reminiscent of recent inflation metrics which show total effects of rising oil prices but little momentum anywhere else. In terms of Industrial Production, we know right where the primary problem exists – automobiles.
Ever since August 2015, the growth of domestic auto production has stalled out. While initially the first eight months or so after that inflection production levels were stable (apart from a sharp drop in May 2016), since October 2016 they have been shifting lower again though very mildly in the downturn. Total assemblies were less than 12 million (SAAR) again in February, up very slightly from January. |
Industrial Production Motor Vehicle Assemblies, Jan 2013 - 2017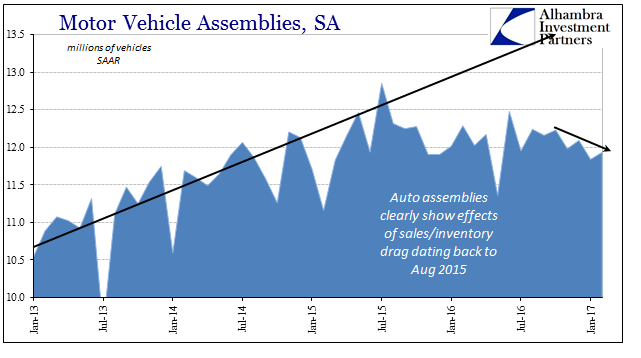 - Click to enlarge |
| Like everything else, auto sales have been marginally better in 2017 than 2016, but not meaningfully better. While that could certainly help, this relative improvement is nowhere near enough to reduce heavy inventories at both the wholesale and retail levels. Clearly automakers are aware of this continuing imbalance, which is most likely why production (and imports) remains subdued and may even become more so. |
Industrial Production Motor Vehicle Assemblies YoY, Jan 2006 - 2017 - Click to enlarge |
| That drag from the auto sector is not confined exclusively to it. In the production of consumer goods, the part of US industry that truly never recovered from 2008, there has been again no growth going back to the summer of 2015. It isn’t really contraction, either, for how can it be having operated for so many years now at such low levels and capacity? |
Industrial Production - Consumer Goods, Jan 2006 - 2017 - Click to enlarge |
| Though the post-crisis period would seem to argue against Milton Friedman’s controversial theory, and instead provide evidence for the competing natural rate theory, I don’t think that is the case at all. For one, the natural rate theory is a complete mess; for it to make any sense given these conditions requires such a low “natural” rate (if there is such a thing, which would be remarkable given that complex systems don’t produce single equilibrium levels, and even if they did it wouldn’t be appropriate for any more than the shortest timescales, perhaps minutes or seconds) or one that is even negative to balance out the theory with observation (no recovery or even growth). |
Industrial Production - Consumer Goods, Jan 1980 - 2016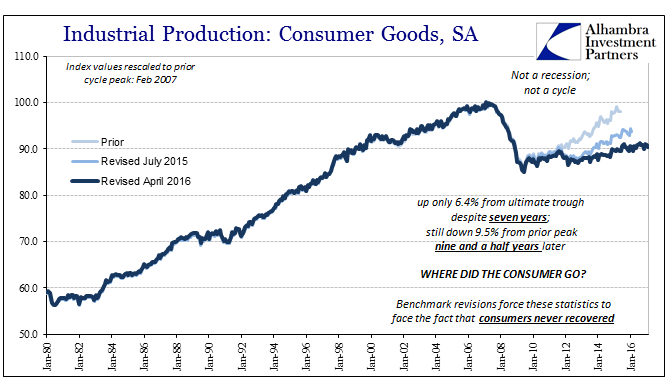 - Click to enlarge |
| Instead, I rather find Friedman’s theory even more compelling in the past ten years, where symmetry is not missing but merely misaligned. If we adjust the general level of potential to what seems the more likely post-crisis direction, symmetry is, in fact, preserved; it’s just nothing like what we would want, in perfect keeping with this whole economy. |
Model of Trend-Cycle Analysis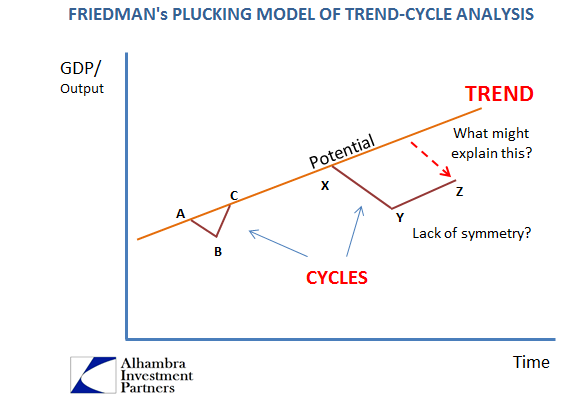 - Click to enlarge |
Model of Trend-Cycle Analysis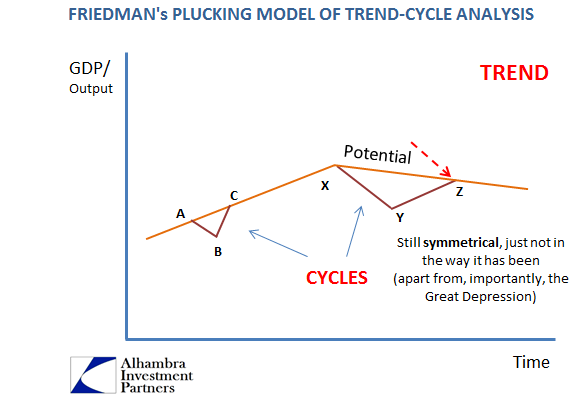 - Click to enlarge |
|
Potential Real GDP - CBO, Jan 2005 - 2020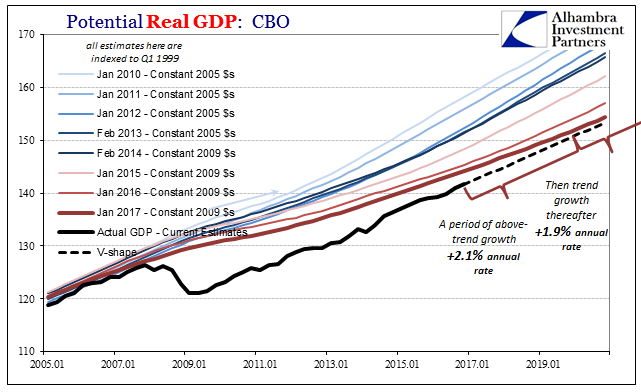 - Click to enlarge |
Tags: automobiles,consumer goods,currencies,depression,economy,Federal Reserve/Monetary Policy,industrial production,manufacturing,Markets,Milton Friedman,Mining,Motor Vehicle Assemblies,newslettersent,OIL,oil production,U.S. Industrial Production