Jeffrey P. Snider
My articles My offerMy siteAbout meMy videosMy books
Follow on:LinkedINTwitterSeeking Alpha
| It may just be that in life you have to get used to disappointment. Though not for lack of trying, I have spent a great deal of time over the years intending to piece together exactly what happened on days like October 15, 2014. The official explanation is an obvious whitewash, one so haphazard that I doubt it will ever be referred to again outside of ridicule. So much changed after that one day, a buying panic in the US Treasury market of all things, that it is worth the effort to try to tease out the whole story – even recognizing the likely futility of trying.
There are other days that over the past few years have offered the same level of significance as well as intrigue, where something happened as stands out in all the right charts for reasons of similarly hidden dynamics. November 20, 2013, is another, for it ended the remainder of Reflation #2 with what surely looks like a swap market massacre. There was January 15, 2015, with the Swiss being run over by “dollars”, and then August 11, 2015, also a day posing a little more clarity, though to this day not enough for my particular taste. One reason for that is June 3-5, 2015, a couple days that don’t immediately spring to mind when recalling the “rising dollar.” |
Belly of the Curve Gone Flat 2009-2017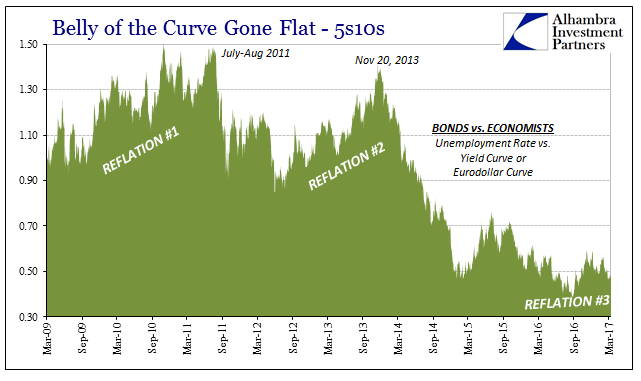 - Click to enlarge |
| It has been my own habit to start China’s “ticking clock” with August 11 that year as each of the forward cycles (if that is what they are) easily from there align with the regular 3-month intervals. I have had trouble with the period before August because it appears to be instead more like five months than three. The outward reason for the difficulty is obvious, as currency trading in CNY during those five months was, to be frank, damn peculiar. |
US Dollar / China Yuan 2015-2017(see more posts on USD-CNY, )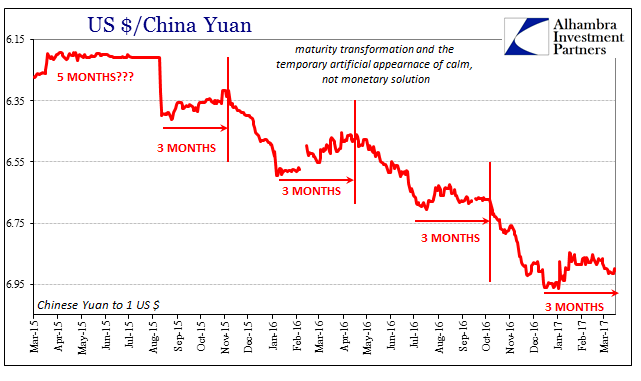 - Click to enlarge |
| If you analyze the chart for CNY from early 2015, however, several easily identifiable events and trends clearly stand out. For one, there was the initial phase of CNY Down = Bad during late 2014 and early 2015, where huge “devaluation” in the Chinese currency coincided with the oil crash, the (first) ruble crisis, and junk bonds (as a proxy for overall risk assets) initially getting hit. Smack in the middle of that CNY drop is the obvious prominence of January 15, suggesting that, given the direction of CNY thereafter, some sort of disturbance in global “dollar” flows from China to Switzerland were redirected by the SNB’s sudden action back to China again. |
US Dollar / China Yuan 2014-2015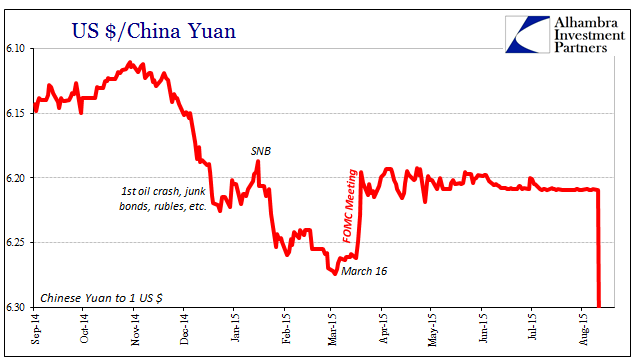 - Click to enlarge |
That CNY turned around afterward in mid-March 2015 isn’t surprising given that it occurred during what was thought to be a “dovish” FOMC meeting (oil prices, not coincidentally, turned around on March 17, too). The world looked like it just might survive the initial “rising dollar” phase with only “transitory” effects. But in looking at the chart for CNY after March 18, it was clear “something” wasn’t right and that “somebody” was doing “something” else to deal with a global monetary imbalance that must have gone back underground. I wrote almost a year before that time, in June 2014, the first version of how this might happen:
It was the seeds of what has become the regular “ticking clock”, for the “dollar’s” condition doesn’t change, or at least it doesn’t change direction though it does intensity. At first glance, that five month period of sideways CNY seems to be a period, singular, and not all that different from CNY during the worst “dollar” period in 2008 and 2009. Upon closer inspection, however, what may appear to be one pattern is actually two: |
US Dollar / China Yuan 2014-2015(see more posts on USD-CNY, )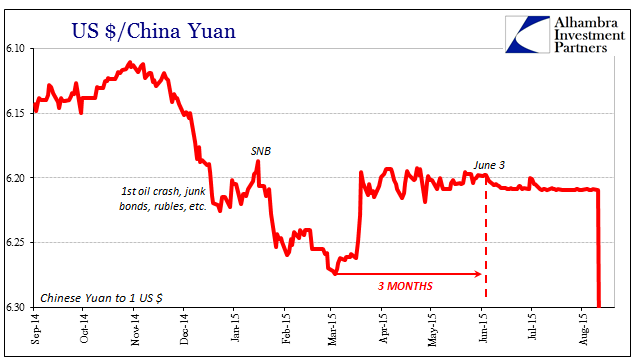 - Click to enlarge |
| We know the “someone” was the PBOC; we know the “something” was providing various forms of “dollar” cover, either direct or indirect. What we don’t know is what changed around June 3, for rather than start the first “ticking” clock the PBOC chose to continue intervening in “dollars” even though it was by then filling the concurrent private “dollar” gap as well as the one it created by the maturities of its own interventions from three months earlier. Did the PBOC think it could simply outlast the “dollar” crisis in the middle of 2015 on Janet Yellen’s (“transitory”) say so?
Maybe, if only in part. There is, as the set up for this article alludes, surely more to the story. Early June 2015 is notable for much more than CNY, and much more than China. For the first part, the briefly exhilarating stock market ascent over on that side of the Pacific came to a crashing end on June 12. The vast majority of that rise took place during the initial three month period of CNY artificial calm. |
Shanghai SSE Composite Index 2014-2015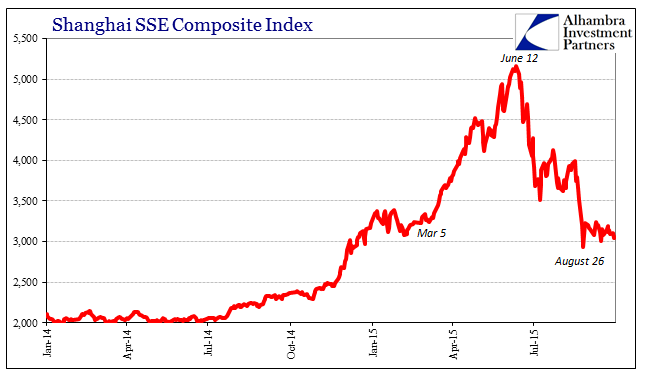 - Click to enlarge |
| More interesting than that is JPY. The ultimate low (going back to 2002) in Japan’s exchange rate with the dollar was registered on June 5, 2015, just a shade above 126. |
JPY / USD 2011-2017(see more posts on USD/JPY, )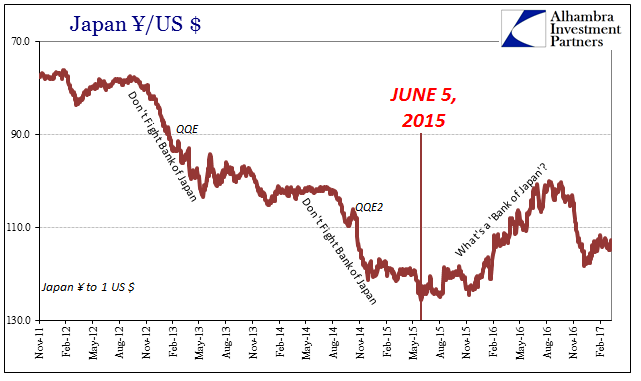 - Click to enlarge |
Before that day, JPY seemed very well behaved from the perspective of the Bank of Japan; after, there was NIRP, dollar swaps, QQE new and improved with Yield Curve Control, etc., all mostly designed to get JPY back in the “right” direction but mostly failing to ever do so. By November 2015, JPY was moving in synchronized fashion with CNY. From that we can speculate the suddenly negative “dollar” connection of Japanese banks to Chinese banks, circumvented occasional by the Chinese central bank. Its exact nature, however, remains a frustrating mystery, just as it was contemporarily. I wrote in July 2015:
This is not to say that all was decent and good about the “dollar” in May [2015], only that it wasn’t nearly so vibrantly depressing. Given the activities in July [2015], we may find out through TIC a few months down the road that this was the proverbial eye of the hurricane…
The stock bubble retreat did not start until June, but China had been in a sort of unnatural stasis about its money markets in the months leading up to that. By many measures, China has experienced historic levels of “outflows”, which are really winding down its version of the “dollar short.”
The yuan has suddenly, right at the March [2015] FOMC meeting, gone limp. Trading has been confined, except for very brief, intraday outbursts, to an increasingly narrow range. Given its behavior particularly as a full part of the reform agenda to that point, this amounts to what can only be hidden and inorganic factors. Whether that means PBOC intervention is unclear, though suggested by even TIC, but this is the most important and unexplained dynamic in the “dollar” world at present.
Indeed, and much to my personal chagrin remains largely so. Do we care for more than just an academic exercise reconstructing for mere posterity what truly happened? Absolutely, because this may have been the ultimate breaking point, the passage of the hurricane’s eye from where all this “global turmoil” which had seemed distant to American perceptions, as it was at the time described as chiefly an overseas concern, would after June 2015 no longer conform to that case (to put it mildly).
Beyond that, there is still the important matter of future reference – or perhaps present. The PBOC did it once, interrupting their own “ticking clock” as a matter of intentional policy and undoing a whole lot of global correlations by doing so, including but not limited to JPY. It would take another month into early July 2015 for those broken correlations to show up clearly, but what was market curiosity before suddenly took on the proportions of a globally harmonized economic downturn complete with “unexpected” market crises all over the place.
Though I have not been able to uncover more than just pieces that amount to little more than speculative theories, on days like today there is that reminder:
U.S. equities posted their worst day of the year Tuesday as banks faced pressure from falling yields, while investors turned their eyes to a key House vote.
Banks under pressure from falling yields? Can’t argue with that.
Tags: $CNY,$JPY,China,currencies,depression,dollar,economy,EuroDollar,eurodollar system,Federal Reserve/Monetary Policy,Japan,Markets,Monetary Policy,newslettersent,rising dollar,USD-CNY,usd-jpy,Yen,yuan