


Marc Chandler
My articles My offerMy siteAbout meMy videosMy books
Follow on:LinkedINTwitterSeeking AlphaAmazon
George Dorgan
My articles My siteAbout meMy videosMy books
Follow on:LinkedINTwitterSeeking Alpha
CFA SocietyEconomicBlogs
Summary:
Many are discussing a possible head-and-shoulders pattern in the Dollar Index.
We are skeptical as other technical signals do not confirm.
We recognize scope for disappointment over the border tax and the next batch of employment data, but European politics is the present driver and may not be alleviated soon.
| Here is the chart nearly everyone is discussing. The Dollar Index appears to be carving out a potential head and shoulders pattern. The left shoulder was shaped by the rally to 102 after the US election.
It fell a little below 99.50 in early December before launching the year-end rally that took it toward 103.80. That area was retested in this year before the downtrend in January and forms the head of the pattern. The Dollar Index bottomed on February 2 near 99.25. It has rallied this month and reached 101.75 last week to frame the right shoulder. The neckline is drawn by connecting the early December and early February lows, as we have done on this Great Graphic, created on Bloomberg. The importance of such chart patterns lies in the measuring objective. The pattern is a little more than a 400 point pattern, which when flipped over, suggests an objective of around 95.50, which is the around where the Dollar Index consolidated last August and September. |
Dollar Index Currency August 2016 - February 2017(see more posts on Dollar Index, )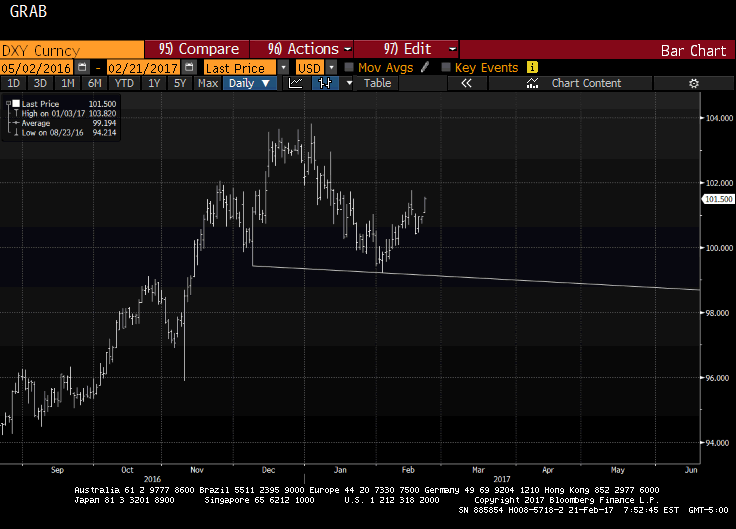 - Click to enlarge |
We are not convinced it is a head and shoulders top. Often volume numbers are helpful in validating a pattern, but in the foreign exchange market, daily volume is not accessible. At a minimum, the pattern requires a break of the 99.25-99.50 area, which also houses the 38.2% retracement objective of the rally since last year’s lows in May below 92.00. Other technical indicators, like the RSI and MACDs, are trending up.
In fact, the Dollar Index gapped higher today. Yesterday’s high was 100.98 and today’s low is 101.08. While it seems true that prices abhor a vacuum as much as nature and the gap below the market may suck prices into it. However, it is not clear the type of gap it is, and the longer it goes without being filled, the more bullish it appears.
Nevertheless, until the Dollar Index rises above where the shoulders of the pattern are ostensibly found (101.75-102.05), some participants may be wary. The first indication of the validity of the bearish read would be a break of last week’s low (~100.40-100.45). But, confirmation of the pattern requires a break of the neckline.
We can envision a fundamental case for this. Even though the odds of the US Senate approving the House plan for a border adjustment have faltered, the failure of Trump to endorse it next week in his speech to a joint session of Congress could see a dollar sell-off. The border adjustment was supposed to pay for a deep corporate tax cut, and without it, a small tax cut can be expected. Also, a softer February jobs report (March 10) could see the odds of a March hike (March 15) diminish.
On the other hand, the dollar driver does not seem to be emanating from the US, even though the recent string of economic data has surprised on the upside, including CPI. Rather the pressure seems to be coming from Europe and the political concerns. These concerns have driven the two-year German yield to new record lows. As funds flee France, Italy, and other southern European countries (except Greece), the downward pressure on German yields is widening the spread with the US. Over the past month, the Germany two-year yield has fallen 17 bp, while the US two-year yield has risen three bp. Over the past week, the US two-year yield is off 1.5 bp, and Germany is off 5.5 bp.
In sum, while price action may look like a head and shoulders top in the Dollar Index, prudence and discipline require confirmation. Other technical indicators are lending credence to the bearish scenario. The speculative positioning in the futures market (to the extent that it is a useful proxy for the broader universe of trend followers and momentum traders) have pared back long dollar exposure in recent weeks. The immediate driver appears to be European politics, where uncertainty will continue to hang over the market for some time. It is possible that Trump’s tax plans and the next batch of US economic data are somewhat disappointing, but we suspect that 1) many do not expect the border tax to be approved, and the trajectory of Fed policy remains intact. We do not think a March hike is particularly likely, but we are being more sympathetic to a May move.
Full story here Are you the author?
Tags: #USD,$EUR,Dollar Index,Federal Reserve,Great Graphic,newslettersent,Politics


