Marc Chandler
My articles My offerMy siteAbout meMy videosMy books
Follow on:LinkedINTwitterSeeking AlphaAmazon
| This Great Graphic was tweeted by the Financial Time’s John Authers, who got it from @fathomcomment. The green line is the inversion of global trade (right-hand scale). The blue line is a trade-weighted average global tariff rate.
What the chart shows is that since 1990, the decline in the average tariff coincided with an increase in trade (remember green line is inverted). However, the as chart illustrates, around the Great Financial Crisis both trends stalled. I am often critical of charts that show two-time series on two different scales as a study in curve-fitting. However, this chart underscores an important point. Global trade in goods and services has slowed, and there is less progress in removing tariff barriers to trade. Part it the story is that tariff barriers have been dramatically cut and the more potent barriers are now often non-tariff in nature. The rise of populist-nationalism is not the cause of the apparently faltering trend, but it could help fuel a reversal. Some argue this means the end to globalization, but this may confuse a particular expression of globalization with globalization as such. For example, although the cross-border movement of capital and products have not surpassed the pre-crisis peak, the levels remains high, and there is a new cross-border activity that is increasing dramatically: information. Consider Skype calls, emails, and other messaging. |
Trade-weighted average global tariff rate and trade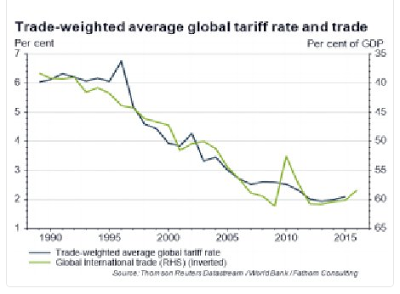 - Click to enlarge |
We have argued that the era ushered in by Reagan-Thatcher ended with the Great Financial Crisis. It is the subject of my new book that will be published shortly (“Political Economy of Tomorrow”). However, it does not necessarily mean a reversal of trade liberalization, though it could. Slower world growth also is a factor that weighs on trade. Also, import substitution in China and the decline in many commodity prices also may weigh on measures of trade.
Nevertheless, many observers are concerned the US and UK are joining eastern and central Europe, as well as Russia and China in spurring a new nationalism. This anxiety is unlikely to go away anytime soon. The optimist case is that 1) the Trump Administration is not as extreme in practice as its rhetoric and 2) France and German provide the firewall and turn back the populist challenge in the Spring and Fall. However, a Le Pen victory (in round two of the French presidential elections) would be seen as the third point (first two are thought Brexit, though UKIP played a role, it was the Tories who engineered it, which is not a populist party, and the US election) of a trend. These issues will likely be a source of anxiety for many for the next couple of quarters, at least.
Full story here Are you the author?
Tags: #USD,Great Graphic,newslettersent,Trade