Pater Tenebrarum
My articles My siteAbout meMy videosMy books
Follow on:TwitterSeeking AlphaFacebook
A Quick Chart OverviewBelow is an overview of charts we picked to illustrate the current market situation. The selection is a bit random, but not entirely so. The first set of charts concerns positioning and sentiment. As one would expect, these look fairly stretched at the moment, but there are always ways in which they could become even more stretched. First a look at the NAAIM exposure index: |
NAAIM Exposure Index, SPX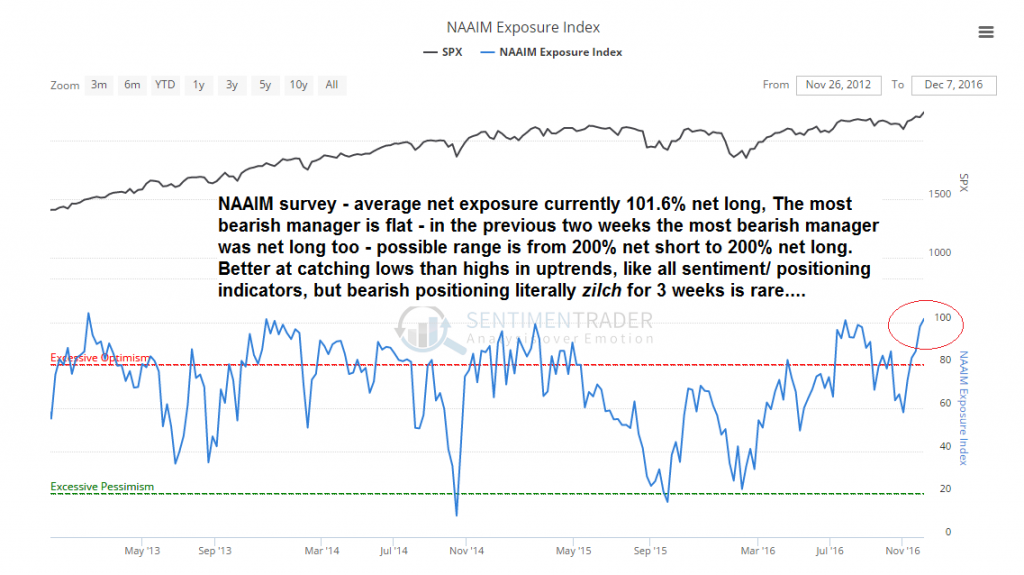 At 101.6% net long (responses can range from 200% leveraged short to 200% leveraged long), fund managers taking part in this survey have reached a fairly one-sided extreme. - Click to enlarge |
| What is even more remarkable than the overall positioning extreme is the fact that there were literally zero bears in the NAAIM survey for the past three weeks. In case you’re wondering, that doesn’t happen very often.
At one point even the most bearish manager was slightly net long. Not too long ago the biggest bears were actually up to 150% net short for quite a while, but their conviction has been destroyed by the post election rally. One cannot blame them, but it is still a case of remarkable unanimity regarding any remaining downside potential. Here is a table showing the progression: |
NAAIM Table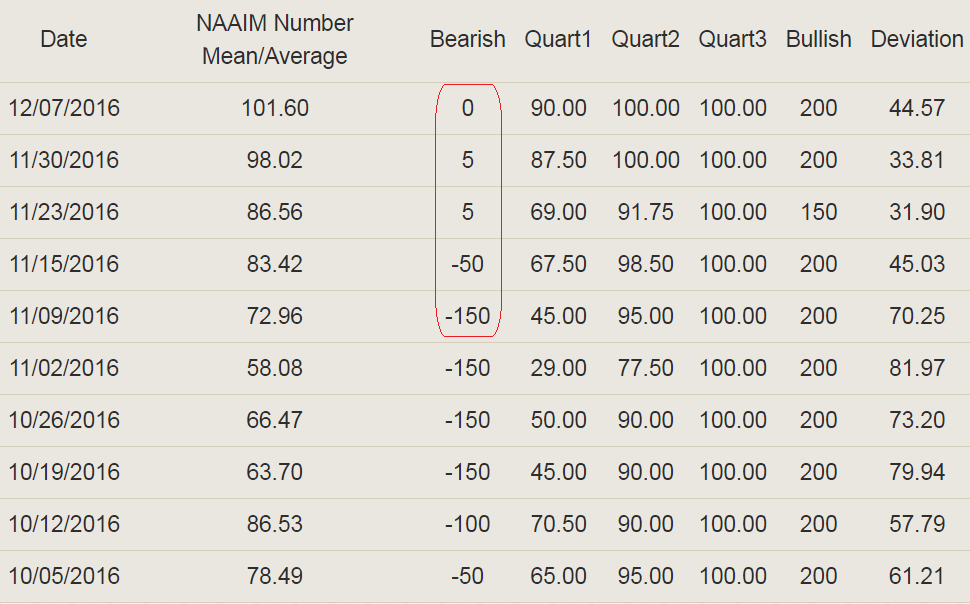 The biggest NAAIM bears have quickly moved from 150% net short to not short at all – the biggest bulls remain 200% leveraged long. - Click to enlarge |
| Next up, a combination of “risk appetite indexes” calculated by sentimentrader (combines the Citigroup Macro Risk Index, Westpac Risk Aversion Index and UBS G10 Carry Risk Index Plus).
As can be seen, the Risk Appetite Index combo is firmly in blue sky territory – it is not useful as a timing indicator, but it does show that there is currently absolutely no doubt visible in any market-based indicators or prices. Everybody “knows” where the journey is going. |
Risk Appetite Index, SPX compared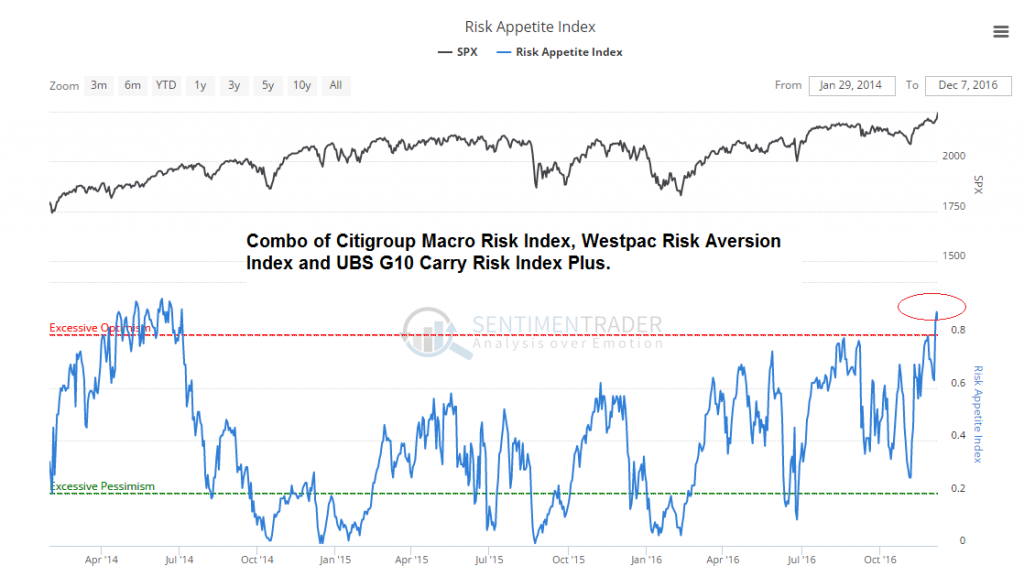 Risk appetite is at a multiyear high – note that this index combo is solely based on market data/ prices, there are no opinions involved. - Click to enlarge |
That is certainly interesting, since Donald Trump was supposed to create uncertainty galore – but currently certainty is actually at a three year high! As an example of Trump-related expectations, here is Paul Krugman on election night:
This was undoubtedly a wide-spread opinion when the election result became clear, with Dow futures down by more than 900 points in Asian trade overnight. So far it was the shortest “never” ever though. Next up, the equity put-call ratio. What is interesting here is that it has recently plummeted to a low last seen in June 2015. Both marked short term peaks in trader enthusiasm. |
CPCE, CBOE Optionas Equity Put/Call Ratio Index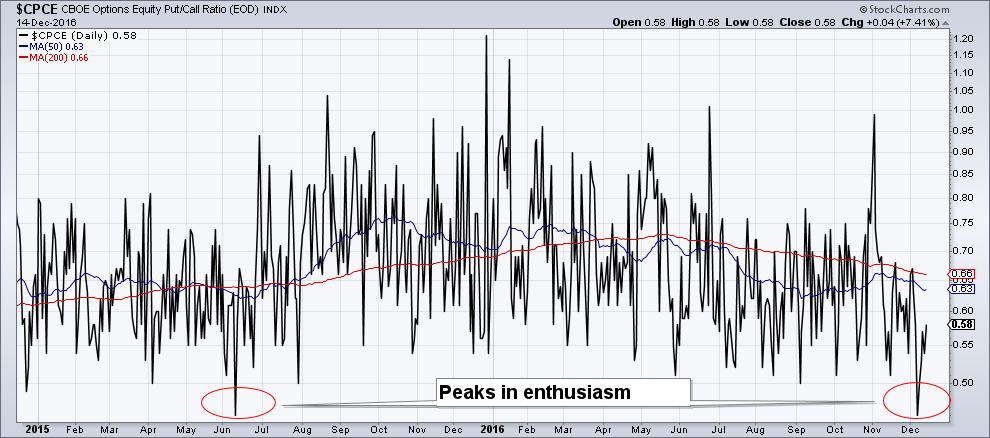 Two rare peaks in the short term enthusiasm of option traders – June 2015 and December 2016. - Click to enlarge |
| What about other equity market drivers? As we have recently pointed out, US money supply growth has re-accelerated significantly (see: “US Money Supply Growth Jumps, Part 1”). A quick aside to this: Part 2, in which we will go into details regarding the shifts described in the part 1, will be published next week.
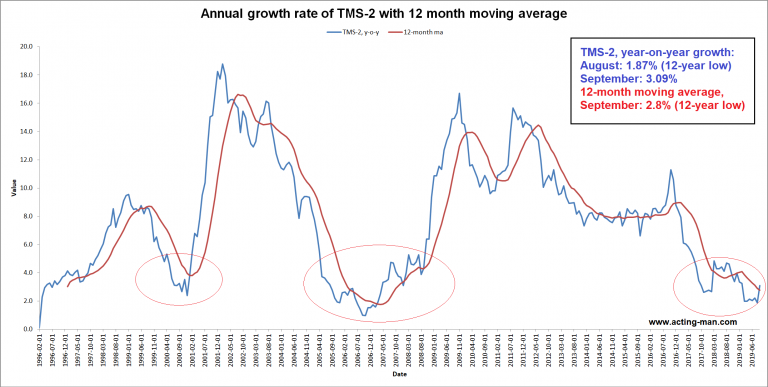
We reproduce two of the charts here that illustrate the recent surge in money supply growth – the y/y growth rate of TMS-2 (broad true money supply) and money AMS (adjusted money supply, a narrow true money supply measure calculated by Dr. Frank Shostak). |
TMS-2 and total loans and leases y/y change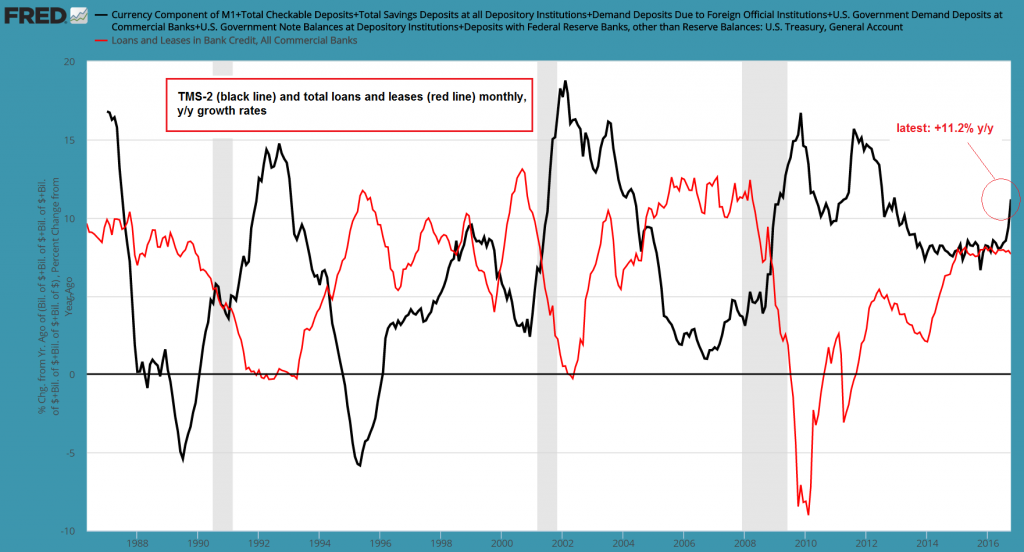 US broad true money supply growth was back up at 11.2% y/y as of the end of October. - Click to enlarge |
| There is plenty of liquidity in the US – the y/y growth rate of AMS recently spiked to levels that haven’t been seen in a very long time: |
US Adjusted money supply YoY growth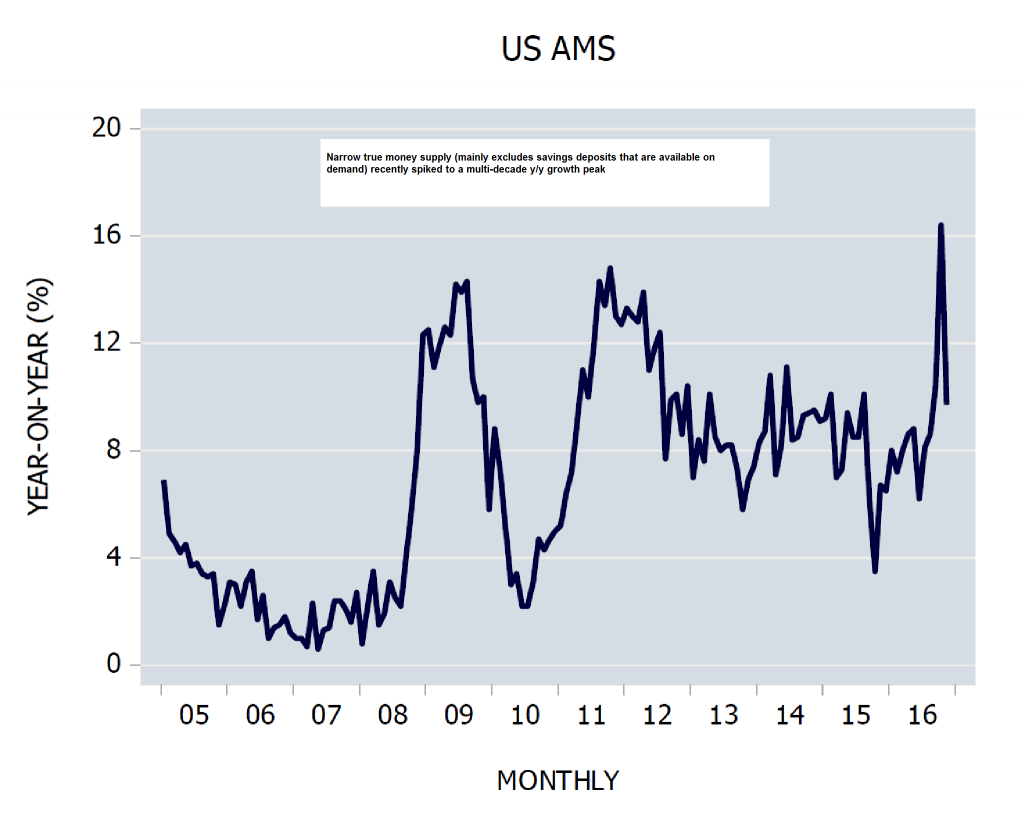 US AMS (adjusted money supply), y/y growth – at the recent peak the growth rate reached the highest level in ages. - Click to enlarge |
| We caution that there are very specific reasons for this, and they have noting to do with growth in commercial bank lending to non-financial sectors in the US.
Nevertheless, liquidity is certainly supportive for the stock market at present. Another supportive datum in the short term is the stock market’s seasonal trend. First a look at the 30-year seasonal chart of the SPX – the year-end rally (Dec. 16 to Jan 03) is highlighted: Between Dec. 16 and Jan 3, the market has risen in 24 of the past 30 years, with an average annualized gain of more than 50% (producing about one quarter of the average annual return of the S&P 500). Seasonals therefore still favor market strength in the short term. Note though that last year the market had its weakest year-end performance in 30 years. |
S&P 500 Index seasonal(see more posts on S&P 500 Index, )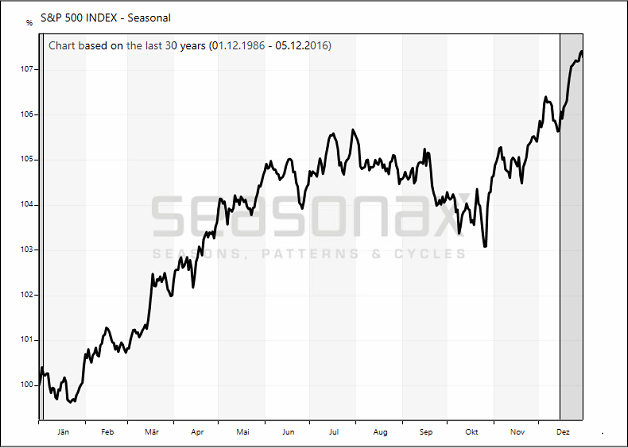 A 30-year seasonal chart of the S&P 500 Index - Click to enlarge |
| Here is a chart that shows the market’s performance in the time period Dec. 16 to Jan. 03 in every single year since 1986:
This is a very reliable pattern in other words; while the market is already quite overbought this year as we enter the final stretch, one shouldn’t be surprised if it worked this year as well. Momentum is still on the side of the bulls. |
S&P 500 Index, pattern returns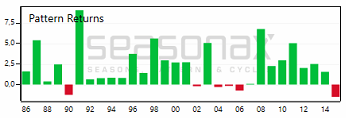 The year-end rally in every year since 1986 - Click to enlarge |
| We are adding a bonus chart – the “at what level does the yuan create panicky feelings?” chart. Not at 6.90, evidently. It did at 6.40 though.
We mention this only to show that most ex-post rationalizations of short term market moves really don’t mean much. These moves are always driven by perceptions and sentiment and the totality of the backdrop. But people always want a simple answer to the question “why has the market done X”, so the financial media will provide one. The weakening yuan (and the associated foreign exchange outflows from China) strikes us as one of the many things that simply don’t matter until they do. The same can probably be said of bond yields. |
USD-CNY rate(see more posts on USD-CNY, ) The onshore USD-CNY rate – global panic at 6.40, perfect serenity at 6.90. - Click to enlarge |
ConclusionRisk has been banished and lives now in exile somewhere, well out of sight. Uncertainty has become certainty across the board. Given recent positioning extremes, risk may soon send a brief message, just to remind us that it isn’t quite dead yet. We will leave you with this: Donald Trump may well succeed in instituting policies that are positive for the economy – which is the perception the recent moves in risk assets are based on. But he doesn’t have a time machine. He cannot go back and retroactively stop the 135% expansion in the broad true money supply since 2008 (US) and the associated explosion in debt levels. He would not only need a time machine for this, but nigh divine powers of intervention as well. And that means that even if the current wave of optimism should turn out to be justified in principle (which remains to be seen), the economy is still structurally distorted. It will still require a bust to return it to a sound foundation from which a genuine, sustainable recovery can ensue. This is of course assuming that we haven’t somehow stumbled on the secret of the free lunch. |
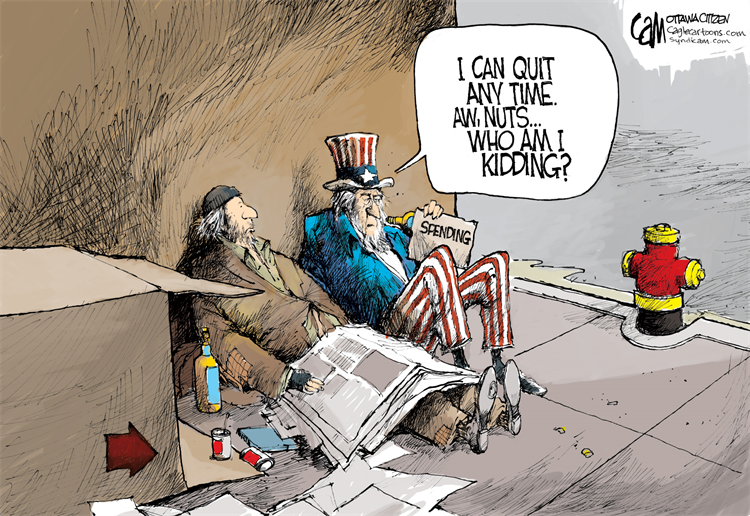
 Lunch is served, but it is really free? Illustration by jgroup - Click to enlarge |
Charts and tables by: SentimenTrader, NAAIM, StockCharts, St. Louis Federal Reserve, Seasonax & BigCharts
Full story here Are you the author?
Tags: Chart Update,newslettersent,On Economy,S&P 500 Index,USD-CNY