Dollar-yen has been driven by the sharp rise in US bond yields.
There are some (dollar) bearish divergences in the JPY/USD technicals.
US 10-year yields may also be putting in a near-term top.
 Since the US election nearly a month ago, the Japanese yen has been the weakest performing major currency. It has fallen 7.5% against the US dollar.
At the risk of oversimplifying, there is one major drag on the yen, and that is rising US interest rates. Consider that the correlation between the US 10-year generic yield and the dollar-yen exchange rate. The correlation between the level of US rates and the exchange rate is near 0.98 over the past 60 days. It appears to be the highest since at least 1990.
When we run the correlation on the basis of the percentage change, the correlation drops to almost 0.60. This is still the upper end of where the correlation has been over the past decade. In the last five years, it has been above 0.70 only a couple of times.
The correlation between the yen and US yields seems tighter than between the yen and the interest rate differential. The correlation between the percent change of differential between US and Japanese 10-year interest rates and the dollar-yen exchange rate is around 0.57, near the lowest level four months. The correlation on the level of the yen and the rate differential is at 0.97, which is the upper end of the multi-years range.
How to reconcile these correlation studies? The interest rate differential is important, but most recently the spread is driven by the US side of the equation. Specifically, over the past month, the US 10-year yield has risen 66 bp, and the Japanese 10-year yield has risen almost 10 bp.
| Despite the rise in the US (and Europe and Australian yields compared with Japan over the past month, Japanese investors have not been significant buyers of foreign bonds. Drawing from the weekly MOF data, we find that four-week average in November is JPY231 bln. The four-week average in October was JPY313 bln. The average of the last four weeks in September was JPY327 bln. In August, it was JPY688 and July; Japan bought an average of JPY1.3 trillion a week in foreign bonds.
Foreign investors have returned to Japanese equities. In the year through November 25, foreign investors have sold an average of JPY129 bln of Japanese equities. However, over the past four weeks, foreigners have bought an average of JPY308 bln. This is the highest four-week average in seven months. To be sure, buying Japanese shares does not mean taking on yen exposure. The interest rate differentials (forwards) and the cross currency basis swap provide powerful incentives to hedge the long yen exposure back into dollars. Over the past month the Nikkei is off 1.4%, but if hedged back into the dollar, the return is 8% plus the credit for the hedge. With the benefit of hindsight, we can see how the dollar carved out a low around JPY100. It took three-four months to accomplish it. Recall that the greenback peaked at almost JPY126 in early June 2015. The rally has brought the dollar back to almost JPY115. The JPY115.60 area corresponds to the 61.8% retracement of the large down move. |
USD/JPY - US Dollar Japanese Yen, November 2016(see more posts on USD/JPY, )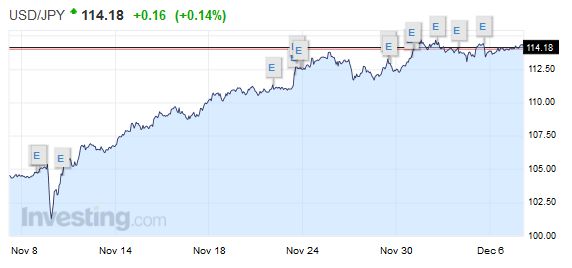 Source: Investing.com - Click to enlarge |
Technical indicators are beginning to flash a yellow light, suggesting caution is in order. Perhaps a tell was that for the first time in a year, the speculators in the futures market as of last Tuesday we net short yen. The RSI and Slow Stochastics did not confirm last week’s dollar highs. The bearish divergence may make momentum traders a bit cautious. Similarly, although US 10-year yields are firm today, the technical indicators warn of consolidation or correction. The RSI and Slow Stochastics did not confirm last week’s yield high, and the MACDs appear poised to turn lower. Last week, the 10-year yield approached 2.50%. The kind of correction we anticipate would push the yield a little below 2.30%.
Full story here Are you the author? Previous post See more for Next postTags: $JPY,newslettersent,usd-jpy,yields


