George Dorgan
My articles My siteAbout meMy videosMy books
Follow on:LinkedINTwitterSeeking Alpha
CFA SocietyEconomicBlogs
We do not like Purchasing Power or Real Effective Exchange Rate (REER) as measurement for currencies. For us, the trade balance decides if a currency is overvalued. Only the trade balance can express productivity increases, while REER assumes constant productivity in comparison to trade partners.
On the other side, a rising trade surplus may also be caused by a higher savings rate while the trade partners decided to spend more. Recently Europeans started to increase their savings rate, while Americans reduced it. This has led to a rising trade and current surplus for the Europeans.
To control the trade balance against this “savings effect”, economists may look at imports. When imports are rising at the same pace as GDP or consumption, then there is no such “savings effect”.
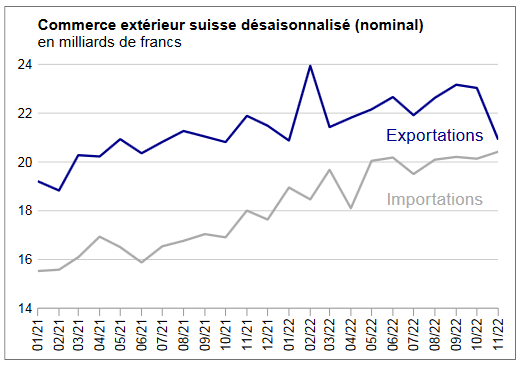
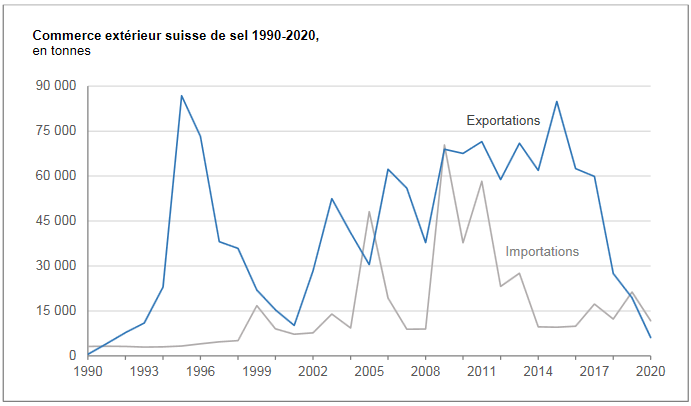
Charts from the Swiss customs data release (in French).
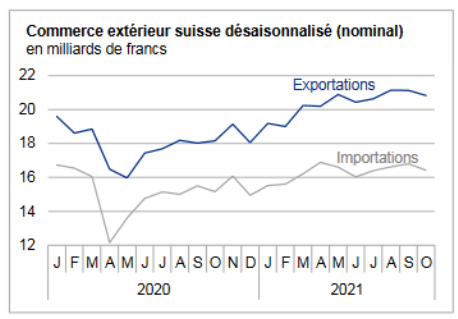
Exports and Imports YoY Development
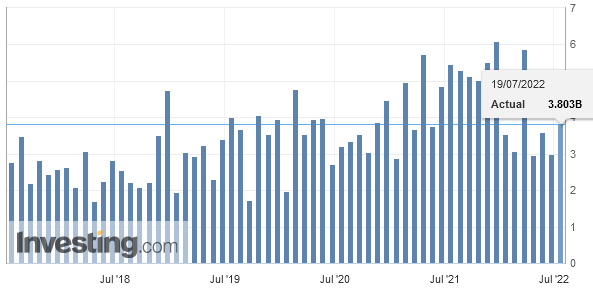
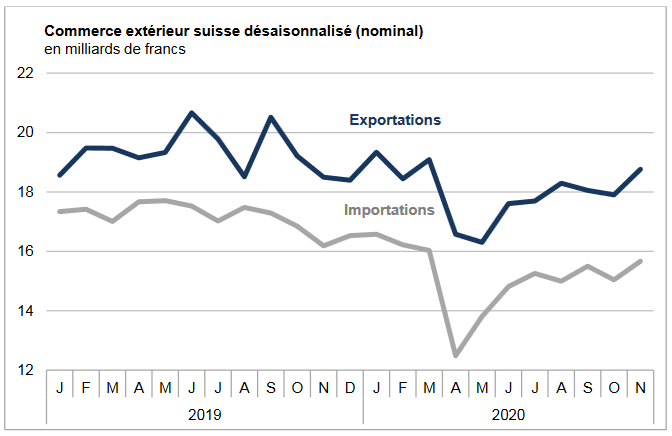
In October 2016, Swiss exports were down 5.6% (in real terms: – 10.4%) against the previous year. Imports rose by 1.8%YoY (in real terms: -1%). Exports fell under the rising trend line, while imports slightly rose. In short ▲ For the first time more than one 1 billion CHF of exports to China ▲ record exports to the USA and of pharmaceuticals ▼ Another big decline in watch and jewelry exports ▼ Weakening of machines and electronics. |
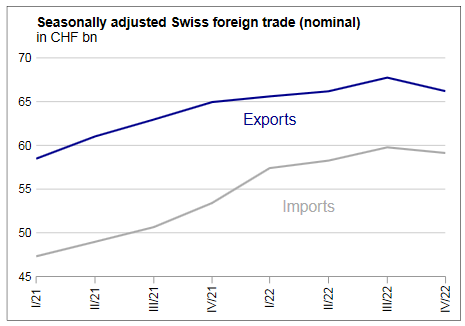
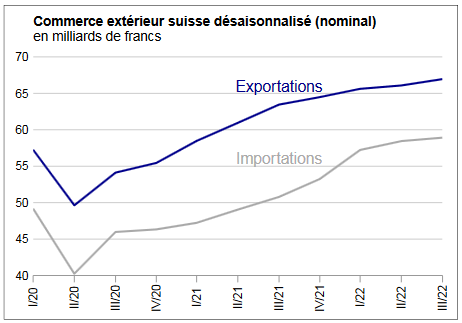
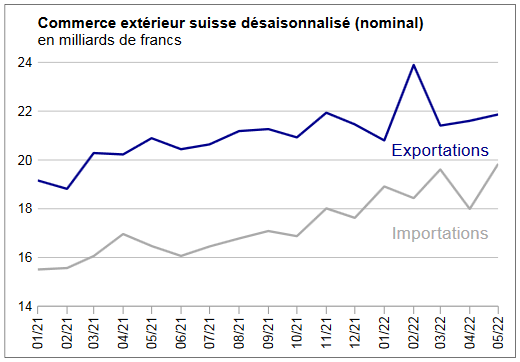
Swiss exports and imports, seasonally adjusted (in bn CHF)(see more posts on Switzerland Exports, Switzerland Imports, )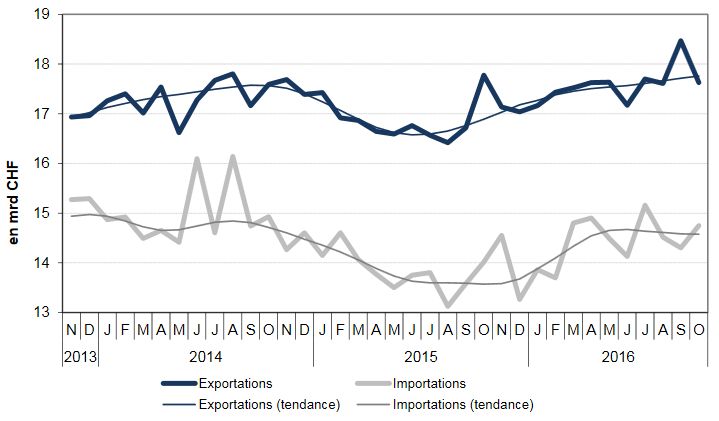 . Source: Swiss Customs - Click to enlarge |
|
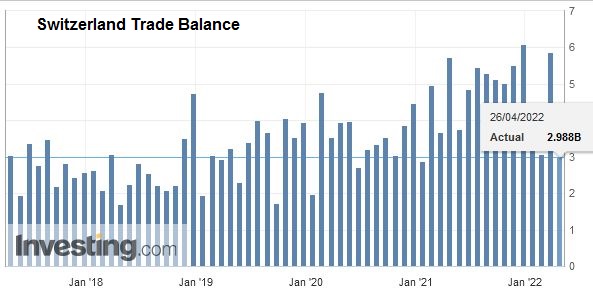
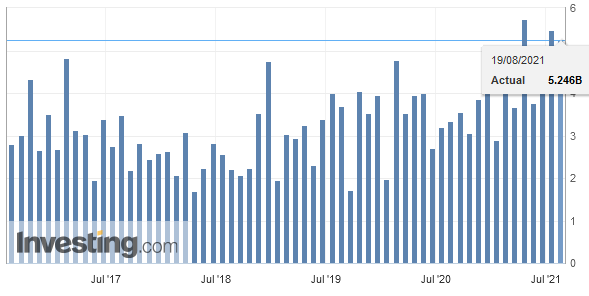
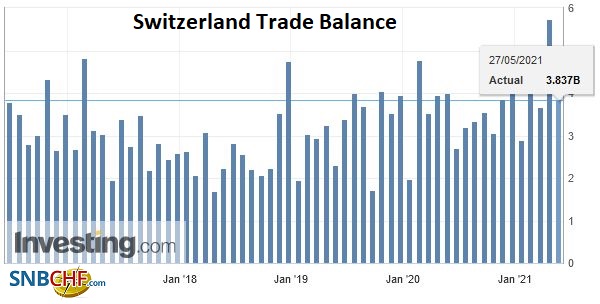
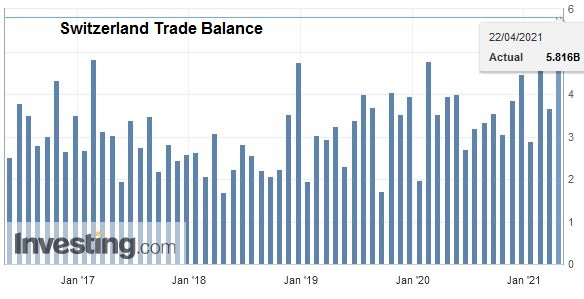
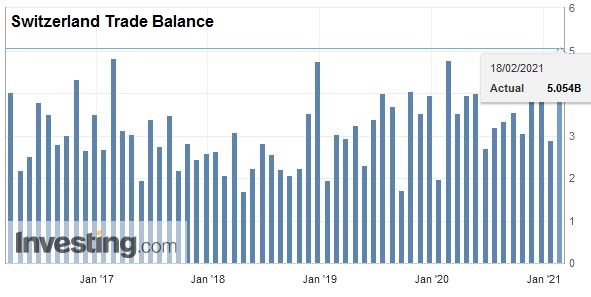
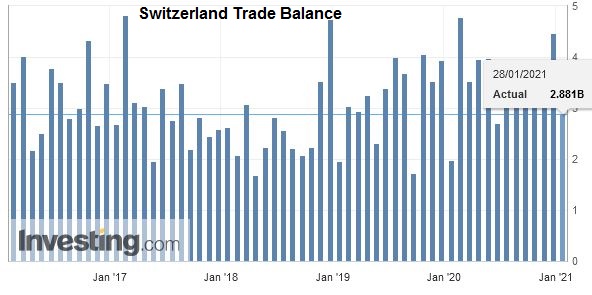
The trade surplus came short of expectations. Analysts had expected a stronger trade surplus. Country Findings for Exports:Asia: Down 7% against last October Europe: Up 1% United States: +6% (driven by pharmaceuticals)
|
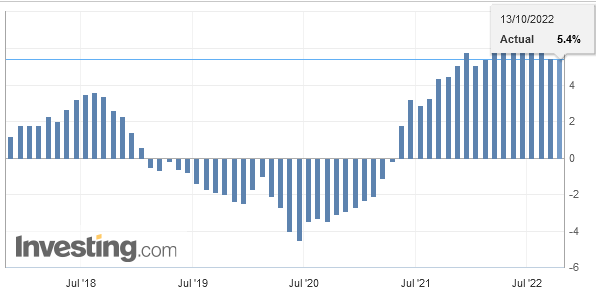
Switzerland Trade Balance, October 2016(see more posts on Switzerland Trade Balance, )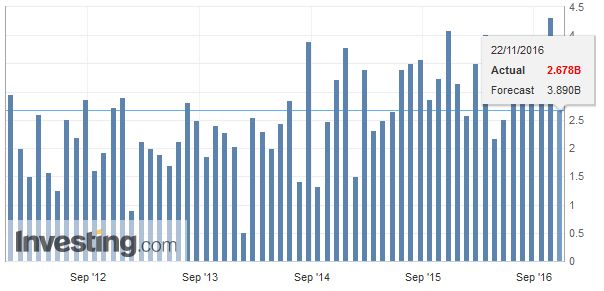 . Source: Investing.com - Click to enlarge |
Sector Findings for Exports:Top-Down from the French data release:
The winner were
|
Swiss Exports per Sector October 2016 vs. 2015(see more posts on Switzerland Exports, Switzerland Exports by Sector, )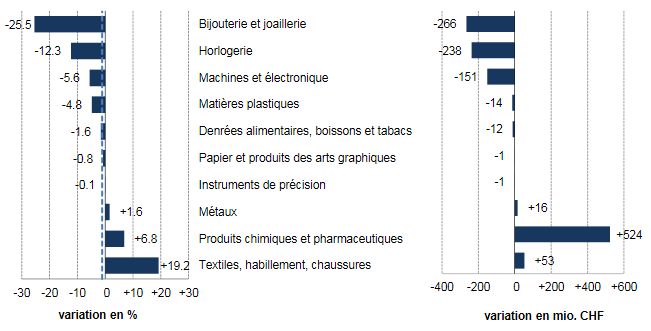 Swiss Exports per Sector October 2016 vs. 2015 Source: Swiss Customs - Click to enlarge |
Are you the author?
Tags: newslettersent,Switzerland Exports,Switzerland Exports by Sector,Switzerland Imports,Switzerland Trade Balance