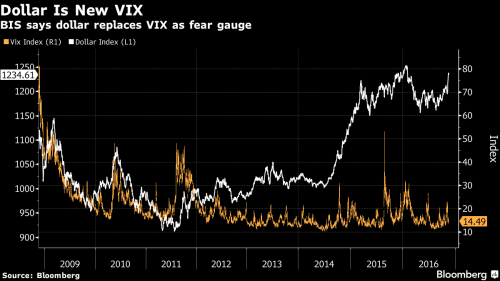
Over the past few years, one of the recurring themes on this website has been an ongoing discussion of how the VIX has lost its predictive value as a market risk indicator. This culminated recently with a note by Russel Clark who explained in clear term why the “VIX is now broken.” Today, in a fascinating note Hyun Song Shin, head of research at the Bank for International Settlements, the “central banks’ central bank” has agreed with the increasingly prevailing conventional wisdom that the VIX is no longer the world’s fear barometer. Instead, Shin believes that the world’s most traded currency is now the true fear gauge: the US Dollar.
In the note titled “The bank/capital markets nexus goes global” Shin makes the accurate assessment that a stronger dollar can depress demand for credit while reflecting reduced investor appetite for the riskiest assets. And while historically the VIX was the “capture all” indicator of systemic stress, that is no longer the case: “there was a tight negative relationship between leverage and the VIX index before the crisis, but this relationship has now broken down. The VIX index – the famed “fear gauge” – no longer has any explanatory power for leverage.”
Picking up on a topic covered extensively by our friends at Artemis Capital Management as far back as 2012, the BIS paper finds that years of monetary easing by global central banks has kept volatility low for stocks while compressing credit spreads which has stripped the VIX from virtually all of its predictive power. At the same time it has pushed more international borrowers and investors toward the dollar.
As a result, “just as the VIX index was a good summary measure of the price of balance sheet before the crisis, so the dollar has become a good measure of the price of balance sheet after the crisis. The mantle of the barometer of risk appetite and leverage has slipped from the VIX, and has passed to the dollar.”
How did this transition from the VIX as an indicator of market stress to the dollar take place? Here is Shin’s brief take:
One variable, the VIX index, stands out as the barometer of the appetite for leverage in the years before the 2008 crisis. The VIX is a measure of the implied volatility from option prices on the stock market.
It has been dubbed the “fear gauge” by financial journalists for its famed ability to track market sentiment. The middle panel of Graph 1 shows that before the crisis, there was a very close relationship between leverage and the VIX index. When the VIX is low, leverage is high; when the VIX spikes, leverage crashes. Given this close association between the VIX index and leverage, a generation of researchers grew up with the VIX as a “wonder variable” in empirical research. The VIX was like the secret sauce that livened up an ordinary dish. The VIX was able to capture the way that risk appetite fluctuated in the financial system. Risk-taking depends on leverage, and if the financial system as a whole goes through a period of ample funding liquidity, even thinly capitalised banks can borrow on easy terms. Since banks borrow in order to lend, easier borrowing conditions translate into easier lending conditions, reinforcing the already easy financial conditions. By the nature of the interactions between liquidity conditions and leverage, the boom phase rides an apparent virtuous circle of greater leverage and easier liquidity. The VIX index was capable of capturing such shifts in sentiment.
Leverage of US securities broker-dealer sector
However, something has changed in recent months, and the VIX no longer works as a barometer of the appetite for leverage. We can see this from the centre and right-hand panels of Graph 1. The middle panel of Graph 1 shows that in the years after the crisis, the VIX index has been subdued, easing to levels close to the lows seen in the years before the crisis. Despite this, leverage has continued to fall. Leverage of the broker-dealers is now around 18, lower than at any time in the last 25 year.
The right-hand panel highlights the structural break by means of two scatter groups of dots. The red dots indicate the relationship between leverage and the VIX for the period up to March 2009, and the blue dots indicate the relationship from June 2009. There was a tight negative relationship between leverage and the VIX index before the crisis, but this relationship has now broken down. The VIX index – the famed “fear gauge” – no longer has any explanatory power for leverage.
Shin correctly writes that this breakdown of the familiar rule of thumb for the VIX has contributed to the sense of puzzlement and unease among observers of capital markets. There is something of a conundrum at the heart of today’s financial markets. On the one hand, there are signs of unabated risk appetite in financial markets, as witnessed in high stock market valuations, compressed credit spreads and subdued volatility, the recent pickup notwithstanding.
Yet, the banking sector is going through a tough time. In contrast to the overall stock market, banking stocks are struggling, with depressed market-to-book ratios, especially for advanced economy banks outside the United States. Why is this?
The answer to this rhetorical question: central banks, of course.
One element in the explanation may be monetary easing. We know that monetary easing has a market-calming effect; it quells the VIX and compresses credit spreads.However, most of this evidence comes from periods when policy rates were positive. We know much less about the impact of monetary easing on bank leverage when policy rates reach zero and dip into negative territory. We cannot rule out perverse effects on bank valuations through the squeeze on bank net interest margins and the flattening of the yield curve.
| As Bloomberg summarizes this, “years of monetary easing by global central banks has kept volatility low for stocks while compressing credit spreads. That has stripped predictive power from the VIX. At the same time it has pushed more international borrowers and investors toward the dollar.”
Indeed, that is the focal point of the BIS note: to get a sense of systemic stress, ignore the VIX which is no longer meaningful due to central bank intervention, but instead focus on the dollar. One look at the chart below, and a very different picture of global systemic risk emerges: While hardly earth-shattering, the realization that in a world with a massive surplus of dollar-denominated debt, and a corresponding shortage of dollar funding – which in turn has led to a persistent skew in FX swaps as we have demonstrated since early 2015 – given the global increase in dollar-denominated liabilities, a stronger currency may lead to lower appetite for investment risk and reduced demand for dollar-lending to acquire relatively volatile assets, according to the report. |
Dollar is New VIX |
This also brings back the familiar issue of swap spreads, which in recent years have diverged materially from their 0 value indicative of a world in which everything is “functioning” normally.
Here is how Shin explains it:
The slow deleveraging of the broker-dealer sector in the post-crisis period, even as the VIX has stayed low, suggests that there is something else holding back the banks. The VIX no longer works as a barometer of the appetite for leverage. If it is not the VIX, is there another variable that has taken over as the barometer of the appetite for leverage?
Any simple answer will be misleading, but there is a surprising candidate for the barometer of the appetite for leverage. The answer is “the dollar”. The dollar has supplanted the VIX index as the variable most associated with the appetite for leverage. When the dollar is strong, risk appetite is weak, and market anomalies such as the breakdown of covered interest parity (CIP) become more pronounced.
To understand why, one has to take a step back and take in the global picture. The deviation from covered interest parity is a mirror to the shadow price of balance sheet utilisation, as it gives an indication of how badly the textbook arbitrage argument fails – of how much money is being “left on the table”. Judged by this metric, the pressures have been building in recent months.
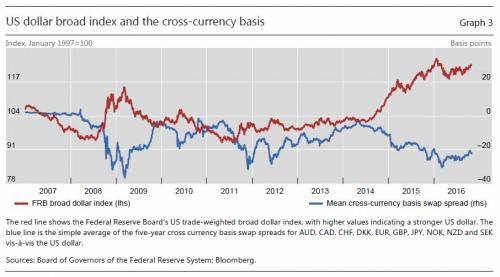
What is the evidence for the link between CIP violations and the dollar? Graph 3 plots daily data for the value of the US dollar (in blue) as represented by the broad dollar index of the Federal Reserve. When the blue line goes up, the dollar strengthens. On the same chart, I have plotted (in red) the average cross-currency basis of 10 advanced economy currencies against the US dollar. Notice how the cross-currency basis is the mirror image of the dollar’s strength. When the dollar strengthens, the cross-currency basis widens. This is especially so since mid-2014, reflecting the stronger dollar since then. Just as the VIX index was a good summary measure of the price of balance sheet before the crisis, so the dollar has become a good measure of the price of balance sheet after the crisis. The mantle of the barometer of risk appetite and leverage has slipped from the VIX, and has passed to the dollar.
US dollar broad index and the cross-currency basis
And then there is the issue of global USD-funded leverage:
What explains the dollar’s role as the summary measure of the appetite for leverage? In a nutshell, the paper shows that there is a tight “triangular” relationship between (1) the dollar, (2) cross-border bank capital flows in dollars and (3) the deviation from CIP. The key to understanding this relationship is that dollar cross-border capital flows closely track the leverage decisions of global banks. The triangular relationship says volumes about the role of the US dollar in the global banking system, and ultimately how the monetary policy backdrop determines global financial conditions.
The funding story is well-known: as interest rates fell to record levels, with some $13 trillion in debt sporting negative yields as recently as this summer, investors have scrambled for higher-yielding assets, aka the reach for duration which explains violent selloffs across the rates market like the one seen recently in the past four days, a carbon copy of the Taper Tantrum. Given the global role of the dollar as a borrowing currency of choice, most of those assets are denominated in U.S. currency. Long-term yields for dollar securities, for example, have been higher than similar-maturity bonds in Japan, the euro area and Switzerland.
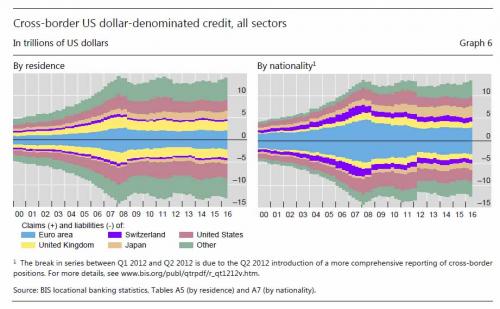
Graph 6 provides a window on the total dollar-denominated cross-border bank intermediation arranged by jurisdiction. In both panels, upward-pointing bars indicate cross-border assets and downward-pointing bars indicate cross-border liabilities. The left-hand panel breaks out the total by residence, while the right-hand panel breaks out the total by nationality, meaning the location of the headquarters. So, for instance, the cross-border claims of a German bank office in London is classified as “UK” in the left-hand panel, but as “euro area” in the right-hand panel. Notice how the undulations in cross-border dollar liabilities have tracked global financial conditions. The totals in Graph 6 grew strongly up to 2008 but contracted with the onset of the Great Financial Crisis, and then with the euro area crisis of 2011–12.
Cross-border US dollar-denominated credit, all sectors
This brings us to the topic of FX hedging, also extensively covered here earlier this year when we observed the record blow out in various currency swaps relative to the dollar. Institutional investors who needed to mitigate the risk of currency mismatches between assets and domestic liabilities have been engaged in USD hedging, which is mostly done through banks. These banks also lay off their own risk by borrowing dollars. This demand implied a dollar “shortage” that made the financial sector more vulnerable to the strength in U.S. currency, BIS researchers said.
“The risk-taking channel of exchange rates turns on the impact of dollar appreciation in a world where many balance sheets have dollar liabilities,” according to Shin. “When so many borrowers have borrowed so much in dollars, whether for hedging or speculative purposes, dollar appreciation exposes borrowers and lenders to valuation changes and, in turn, impacts their balance sheets.”
And therein lies the rub: the ongoing surge in the dollar, while on one hand indicative of US economic strength and the Fed’s intentions to tighten monetary policy, is at the same time a far more troubling indicator of rising systemic stress as a result of soaring funding costs that underpin trillions in USD-based hedges that are the “glue” that keeps the existing banking system together.
As Bloomberg puts it, this signals that the dollar’s surge after Donald Trump’s U.S. electoral victory shouldn’t be interpreted as a clear sign of confidence across markets. Quite the contrary.
Why does all of this matter, Shin rhetorically asks?
He answers that The dollar as the barometer of leverage and risk-taking capacity has implications both for financial stability and the real economy. If banks put such a high price on balance sheet capacity when the financial environment is largely tranquil, what will happen when volatility picks up? If banks react to resurgent volatility by reducing their intermediation activity, as happened during the 2007–09 crisis, the banking sector may become an amplifier of shocks rather than an absorber of shocks.
| How will events play out this time? Well, with the dollar once again soaring thanks to the Trump Rally, we may find out very soon. As a reminder, during the last financial crisis, it was the global central banks’ who stepped in to provide the trillions in funding as the global dollar shortage emerged suddenly and destructively, as we explained back in 2009. This time around, the total potential global dollar shortage is far, far greater.
We can only hope that the Fed is aware of these implications as it – and the new administration – blindly push for a dollar that has not been this strong since the last financial crisis. |
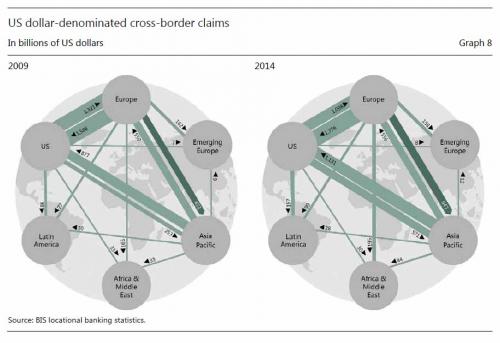
US dollar-denominated cross-border claims |
Full story here Are you the author? Previous post See more for Next post
Tags: Bank of international Settlements,Business,Capital Markets,central banks,debt,Federal Reserve,Finance,Financial crises,Institutional Investors,Japan,Market Sentiment,Mathematical finance,Monetary Policy,newslettersent,Switzerland,Technical Analysis,US Federal Reserve,VIX,Yield Curve


