Summary:
Interest rates and 10-year break-evens are rising.
Some think the CRB Index is tracing out a head and shoulders bottom.
We look for inflation in non-tradable goods’ prices (think services).
| Bond yields are rising. The break-even rates, which compare conventional yields to the inflation-linked securities are also rising. These developments, which we do not think can be attributed to central bank policy, encouraged us to take another look at commodity prices.
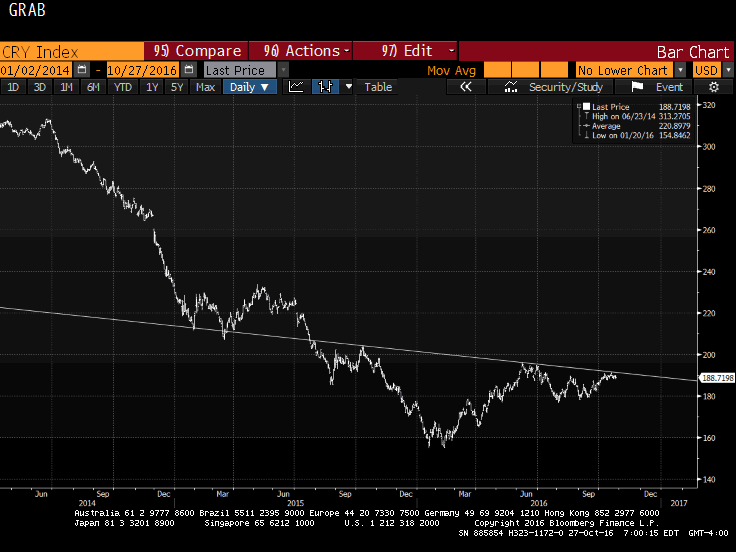
Some investors are talking about a potential head and shoulders bottom in the CRB Index. This Great Graphic, created on Bloomberg, draws the neckline to the pattern that has been unfolding over the past 14 months. The neckline is found near 191.80, and by the end of next month, it is closer to 190. It is trading a little heavier today. It is the second days of losses, and unless it recovers over the next 36 hours or so, it will finish lower for the second week, snapping a four-week advancing streak. The importance of chart pattern, like the head and shoulders, is the price projection upon the confirmation. The confirmation is a convincing violation of the neckline. From the head to the neckline is about 35 points, so a break of the neckline projects 35 points higher as an initial target. That would be the CRB to around 225. The would bring the index into the gap created by the sharply lower opening on 6 July 2015. This technical work could be part of a largely bullish story. Commodity prices peaked around the middle of 2008. Commodity prices collapsed. The CRB Index reached a high near 474 and put a low in early this year a little below 155. By June it had gained 27% but has been trading mostly sideways between 176 to 190 since the peak (~196). Nevertheless, we are not convinced that rise in yields and breakevens (ostensibly reflecting an increase in inflation expectations). Although one would be on the lookout for a reversal pattern after a prolonged decline, we are not convinced that a head and shoulders bottom is being carved. The technical indicators suggest it may be a broad sideways trend, with the risk to the downside. The Slow Stochastics and the MACDs have turned lower. Moreover, if it was just headline inflation rising, it might not be so important for many (though not all central banks). For them, the core rate is more revealing, even if it is not targeted. Also, price pressures of tradable goods continue to be muted, but non-tradable goods inflation is stronger. In the US, for example, rising price pressures are evident in medical services and rents. |
CRB Index |
Full story here Are you the author? Previous post See more for Next post
Tags: commodities,inflation expectations,newslettersent


