Marc Chandler
My articles My offerMy siteAbout meMy videosMy books
Follow on:LinkedINTwitterSeeking AlphaAmazon
George Dorgan
My articles My siteAbout meMy videosMy books
Follow on:LinkedINTwitterSeeking Alpha
CFA SocietyEconomicBlogs
Summary:
China’s PPI rose for the first time in four years.
It is related to the rise in commodities.
Yet there are good reasons there is not a perfect fit between China’s PPI and commodity prices.
US and UK CPI to be reported next week, risk is on the upside.
| China reported its first increase in producer prices in four years earlier today. As one might suspect, producer prices are often driven by commodity prices. The red line is China’s PPI and the blue line is global commodity prices. Yet the fit is not really as tight as this Great Graphic seems to show (h/t Christopher Balding).
One should be suspicious of charts that show two-time series and two scales. The pictures look pleasing to the eye, but they typically are not robust. It is a not too subtle form of curve-fitting. It is not clear to what global commodity prices are included in the above chart means. We have taken a quick stab at showing what two common commodity price indices look like when normalized (put on a single scale) with China’s producer prices. |
China Producer Price Inflation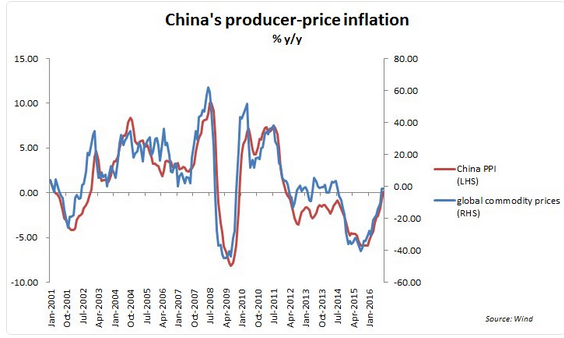 China Producer Price Inflation - Click to enlarge |
| This first chart from Bloomberg looks at the CRB Index (yellow line) and China’s PPI (white line). They had been normalized and begin at 100 in October 2000. Co-movement is still evident by not nearly as tight as suggested by using two scales. There can be numerous reason why the tracking is not perfect.
The most obvious one is that the CRB basket is different from China’s PPI basket. What are the chances China’s PPI is nearly identical with a global commodity basket, as the first chart suggests? Another reason the two-time series are not identical could be the exchange rate. The CRB is measured in dollars while China’s PPI is composed of yuan-denominated goods. In the second Bloomberg chart, we looked at China’s PPI (white line) alongside the JoC-ECRI Industrial Price Index (yellow line). Both time series have been indexed to start at 100 in October 2000. There is some co-movement but it even looser than seen with the CRB Index. |
Producer Price Inflation . - Click to enlarge |
| That said, leaving aside Japan, it does look like deflationary pressures have large bottomed and price pressures are rising. The UK and the US report September CPI on October 18. The risk to both is the upside. UK CPI is expected to rise from 0.6% to 0.9% on a year-over-year basis, while the core rate is expected to tick up to 1.4% from 1.3%. Base effects, higher energy prices, and a record low trade-weighted index will likely see inflation accelerate through the start of next year.
The headline US CPI is expected to rise to 1.5% from 1.1%. It would be the highest since late-2014. There are also favorable base effects that make for favorable comparisons through early next year as well. The core rate stood at 2.3% in August. The risk is on the upside, though the median expects unchanged. |
 . - Click to enlarge |
Full story here Are you the author?
Tags: China,China Producer Price Index,commodities,Great Graphic,inflation,newslettersent