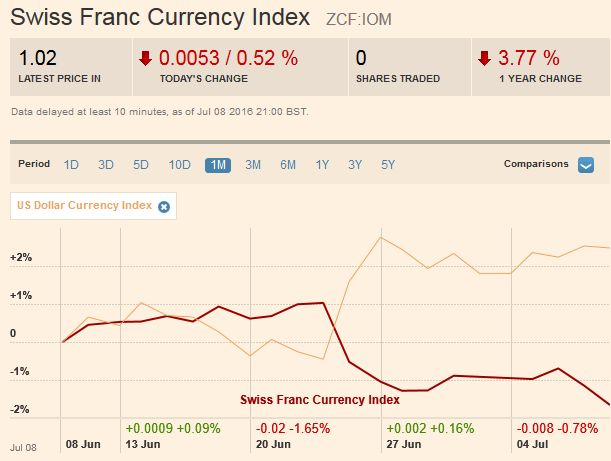
Swiss Franc Currency IndexIn the Brexit month, the Swiss franc index clearly underperformed the dollar index. The major reason is that the dollar is seen as a better safe-haven than the Swiss Franc, possibly because Swiss sales are affected more when British demand falls.
|
|
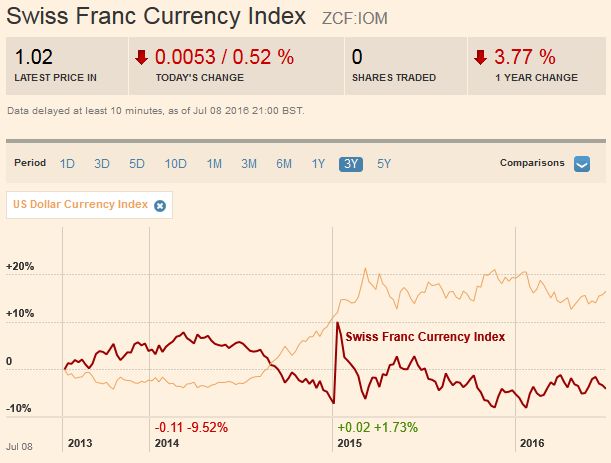
Swiss Franc Currency Index (3 years)The Swiss Franc index is the trade-weighted currency performance (see the currency basket)On a three years interval, the Swiss Franc had a weak performance. The dollar index was far stronger. The dollar makes up 33% of the SNB portfolio and 25% of Swiss exports (incl. countries like China or Arab countries that use the dollar for exchanges). Contrary to popular believe, the CHF index gained only 1.73% in 2015. It lost 9.52% in 2014, when the dollar (and yuan) strongly improved.
|
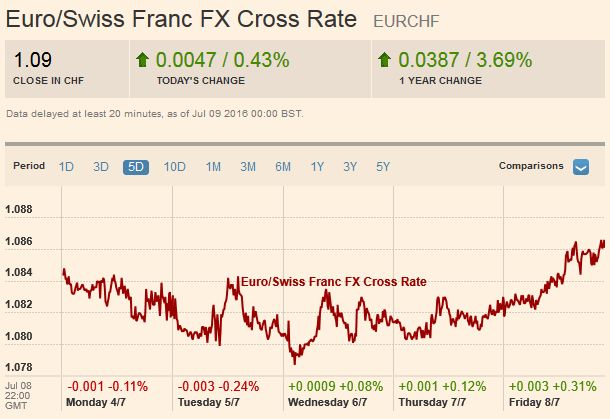
EUR/CHFOver the past week the euro achieved gains versus the franc This was achieved only, because the SNB intervened again heavily. The pound, however, has fallen another 3% against CHF.
|
FX Rates July 04 to July 08, 2016 |
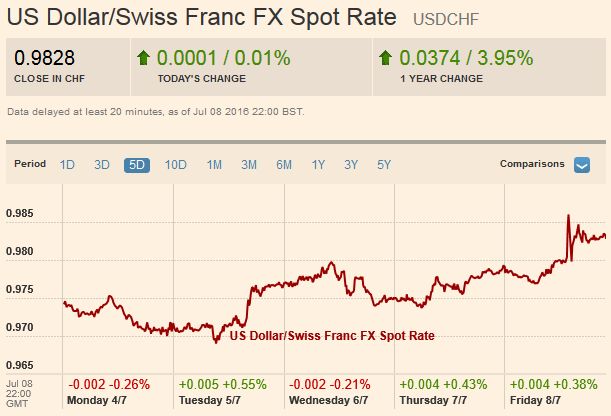
USD/CHFThe dollar remains very strong against CHF. It is up nearly 4% in the last year. The Swiss franc remains undervalued against the dollar, given that USD/CHF was between 0.75 and 0.80 in 2011.
|
|
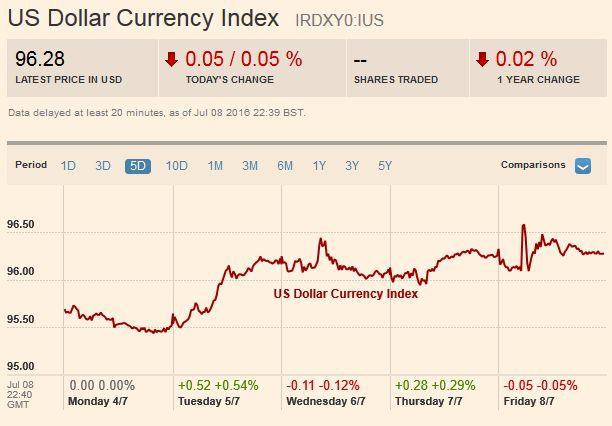
US DollarThe US dollar had a good week. It was helped by the strongest service
ISM this year, with strong gains in forward-looking new orders component and an increase in export orders. Non-farm payrolls snapped back from a downwardly revised 11k jobs (-6k private sector) to 287k (265k private sector). It was the strongest employment gain in eight months. Also, as more bonds denominated in euro, yen, and Swiss francs offer negative nominal yields, an increasing part of the world’s savings appear to be drawn to the positive returns of dollar-denominated paper. The dollar advanced against most of the major currencies, except the irrepressible yen, and the Australian and New Zealand dollars. The RBA was neutral, and the RBNZ hinted that until new macro-prudential policies were implemented to address thehousing market, a rate cut could be counterproductive. The greenback also appreciated against most emerging market currencies. The only exception to note is the Argentine peso. After selling off 12.25% in the second half of June, it recovered 2.3% last week. |
FX Rates July 04 to July 08, 2016 |
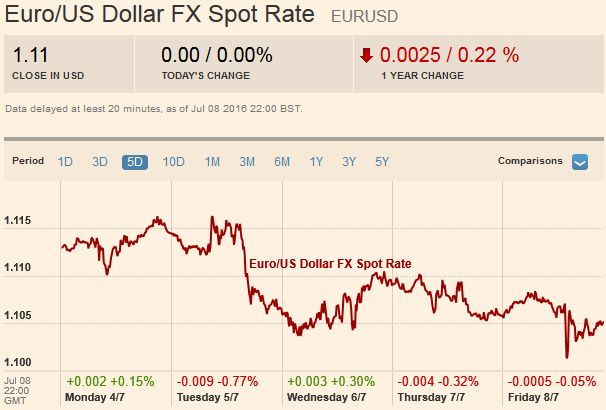
EUR/USDThe euro recovery from the Brexit shock ended with a outside down day on July 5. The euro had reached a low a little below $1.0915 on the referendum news, and then recovered to $1.1185 before reversing lower. The euro retraced more than 61.8% of that rally (~$1.1020) and spent most of the pre-weekend hours straddling the $1.1050 area, which corresponds to the 50% mark. A break of $1.10 will re-target the Brexit low, and below there is the $1.08 area that previously was the lower end of a trading range. On the upside, initial resistance is pegged on the |
|
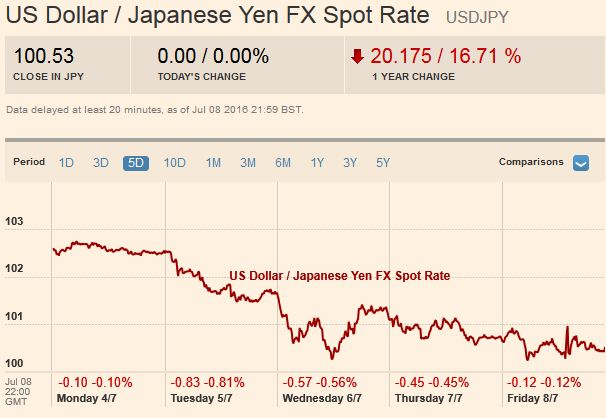
USD/JPYThere has been no reprieve for the yen. The yen gained about 1.8% against the dollar last week, leaving the greenback holding just above JPY100.
A break would immediately target JPY99.00, the Brexit spike low, but increasingly there is talk of a move toward JPY95. The initial cap is seen near JPY101.50, with convincing penetration, allowing for JPY103.00.
We remain skeptical of the conventional narrative that explains the yen’s strength as safe haven demand.
Portfolio flows that track purchases of bills and bonds show foreign interest (though two week ago foreign investors sold a near-record amount of fixed income instruments), but not in sufficient size by themselves, and especially if the inflows are netted to account for Japanese portfolio capital outflows, to account for the yen’s surge.
Nor are speculative flows, extrapolating from activity in the futures market adequate to the explanatory task at hand.
Long Yen Hedges on foreign portfolio investmentsThe most compelling hypothesis is that the upward pressure on the yen is being driven by Japanese asset managers raising long yen hedges on foreign portfolio investment.
Japanese corporations who retained foreign earnings in high yielding foreign currency securities may also be increasing hedges. In effect, the yen strength is the unwinding of the substantial yen short that Japanese institutional investors and corporations had amassed during the early days of Abenomics.
|
|
GBP/USD
|
|
AUD/USD
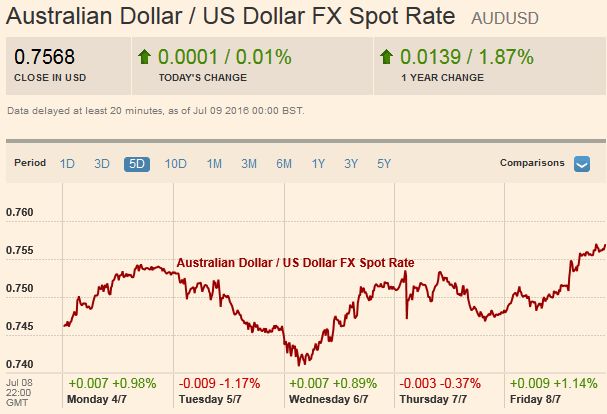
Whereas the Canadian dollar lost about 1.0%, the Australian dollar gained around 0.8%. The Australian dollar has been resilient to the political uncertainty and the A soft report, coupled with a firm currency, could spark speculation that the central bank may use the scope to ease monetary policy. |
|
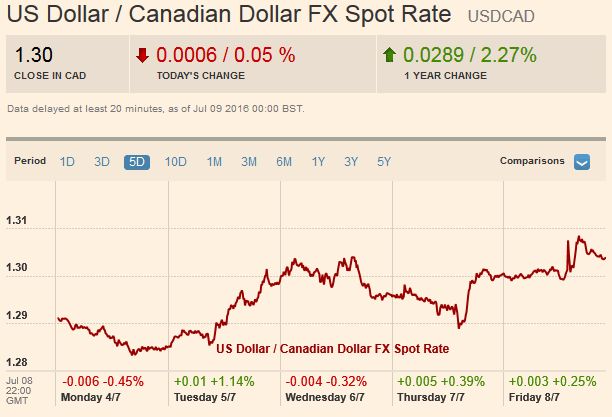
USD/CADThe US dollar rose against the Canadian dollar though it fell against the other dollar-bloc currencies. The 7.5% drop in crude oil prices, the largest fall in five months, did the Canadian dollar no favor. Canadian employment data was disappointing, and the economic momentum appears to be fading. The Bank of Canada will likely recognize that job creation nearly stalled in Q2. The trade country’s trade deficit rose to record levels in April-May. The US dollar is nearing a band of resistance that runs from CAD1.3085 to CAD1.3145. We expect this area to be overcome, and for the US dollar to rise into the CAD1.33-CAD1.35 area in the period ahead. |
|
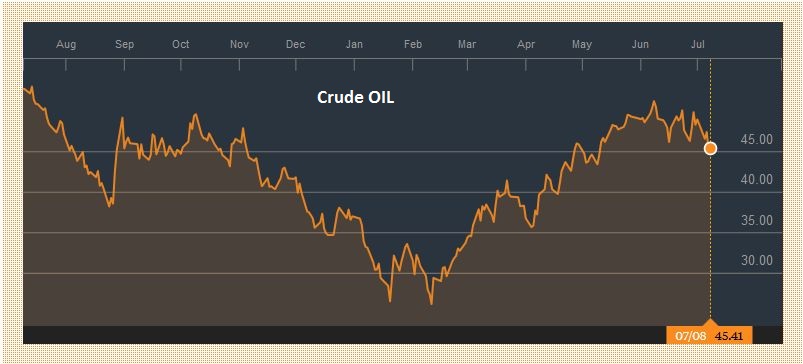
Crude OilOver the past month, the price of the light sweet August crude oil contract has fallen by nearly 15%. Brexit has raised the possibility of weaker demand (mostly as a result of weaker growth in Europe).
Although US inventories continue to be drawn upon, the rig count has begun rising. It has increased for five of the past six weeks. The August contract is has frayed a trendline drawn off the January, February and April lows. It is found now near $45.50, which is about a dollar above the 38.2% retracement of the rally in the H1, which the dollar neared before the weekend. The technical indicators give little reasons to think that a bottom is at hand but anticipate corrective upticks early next week.
|
 Click to enlarge. Source Bloomberg.com
|
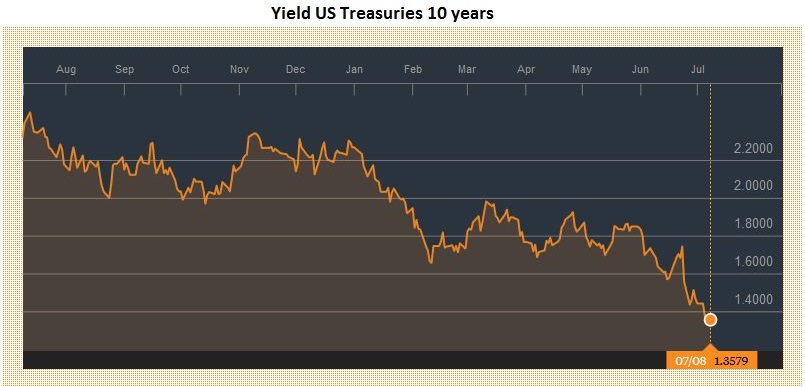
US TreasuriesEven the strongest jobs growth since last October was unable to stop buying of US bonds. The US 10-year yield fell eight basis points to 1.36%
last week. The low print seen midweek was just below 1.32%. It is not consistent with the data to suggest that the low yields (and the shape of the yield curve) are investors anticipating a recession and/or deflationary shock.
The main impetus to the drop in yields appears to be what is happening in Europe and Japan. The increasing number of negative yielding instruments and the depth that is being reached since the zero-threshold has been abolished over there are driving US yields down.
This liquidity narrative can explain more of the agreed upon facts (including the economic data and international variables) than the recession narrative.
The technical indicators of the September 10-year note futures suggest scope for new highs in the near-term. |
 Click to enlarge. Source Bloomberg.com |
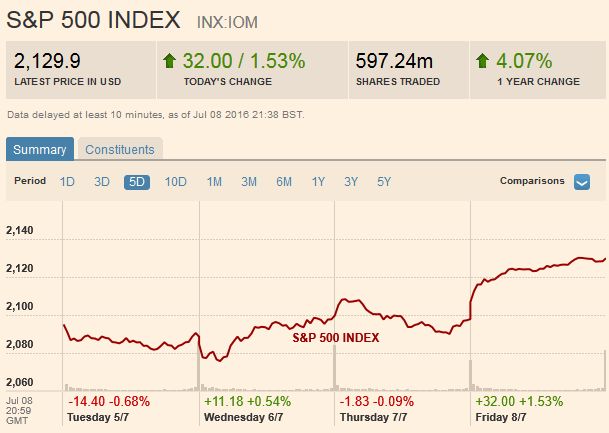
S&P 500We had expected the S&P 500 to recover from the Brexit decline, but we had anticipated a “W”-shaped bottom rather than the “V” that has taken place.
The S&P 500 finished the week at new highs for the year. The strong
close will encourage a near-term test on the old record highs (~2135). We note that the dividend yield of the S&P 500 (~2.15%) is now above the 30-year Treasury yield. One note of caution comes from the start of the US earnings season in the week ahead. US corporate earnings likely fell for a fifth consecutive quarter for the first time since the Great Financial Crisis. According to Factset,
the 12-month forward P/E ratio is 16.6, which puts it above the five-year average of 14.8 and 10-year average of 14.3. |
Charts and CHF data added by George Dorgan and the snbchf team, Text Posted by Marc Chandler on Marc to Markets,
Are you the author? Previous post See more for Next postTags: Bank of Canada,Canadian Dollar,Crude Oil,Dollar Index,EUR/CHF,EUR/USD,FX Weekly Review,MACDs Moving Average,newslettersent,Safe-haven,Swiss Franc Index,U.S. Nonfarm Payrolls,U.S. Treasuries,USD/CHF,USD/JPY


