Marc Chandler
My articles My offerMy siteAbout meMy videosMy books
Follow on:LinkedINTwitterSeeking AlphaAmazon
Oil prices reached their highest level in eleven months in the middle of last week. The front-month futures contract did not post a key reversal on June 9, but the continuation contract did. Since reaching almost $51.70 then, prices have pushed lower, with lower highs and lower lows.
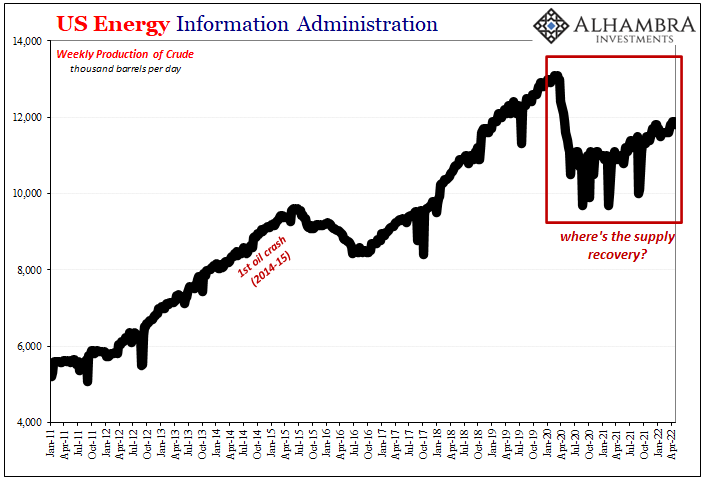
| As this Great Graphic created on Bloomberg shows, a trendline drawn off the mid-February cyclical low, and hitting the early and mid-April lows comes in today near $47.70. The firmer dollar may be playing a role, but so is news that the US rig count has increased for two consecutive weeks now. |
 click to enlarge |
The broader technical tone has weakened. The RSI has turned lower. The MACDs are also turning lower with a bearish divergence. The five-day moving average may move below the 20-day moving average for the first time since mid-April later this week. Yesterday’s close was the first below the 20-day moving average since early April, which also speaks to the loss of momentum. A break of $47.80 now would likely signal a move below $47.00. Of note the, lower Bollinger Band (two standard deviations below the 20-day moving average) is found near $47.30.
Technically, it may make sense to look at the retracements of the whole move. The 38.2% of the rally since mid-February is a little below $42.00. However, if that was an overshoot, it might make more sense to take the retracement from the first correction to the recovery that took place in early April near $35. The 38.2% retracement of that move is found near $45.40 and seems like a more realistic target.
Full story here Are you the author?
Tags: Great Graphic,newslettersent,OIL