


Marc Chandler
My articles My offerMy siteAbout meMy videosMy books
Follow on:LinkedINTwitterSeeking AlphaAmazon
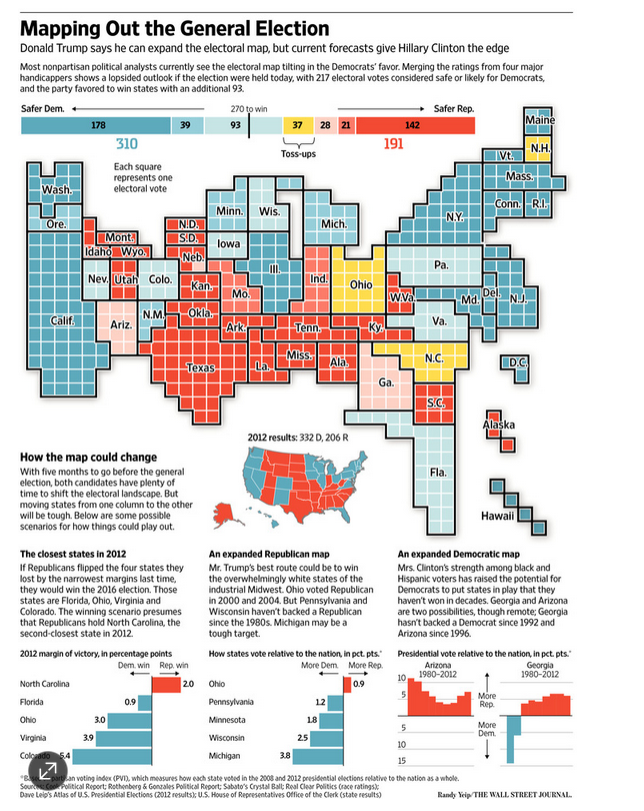
This infographic was in the Wall Street Journal on the US election. It is important to remember that the US does not elect the President by direct popular vote. This makes the national polls a bit misleading.
There are 538 electoral college votes. To be elected a candidate must secure a majority or 270 electoral college votes. Obama received 332 elector votes and Romney 206.
The WSJ cites four major nonpartisan handicappers. They find that if the election were held last week, there are 217 electoral college votes that are safe for the Democrats and another 93 leaning their way (for a total of 310 electoral votes).
If Trump is going to win, he must do better than Romney. However, looking at the map makes it seem difficult. Consider five swing states that were the closest in 2012. Romney picked up one, North Carolina by a 2.0% point margin in the popular vote. The other four went to Obama. Florida went with Obama in both 2008 and 2012 after it was taken by Republicans in 2000 and 2004. Going back to 1976, the Republicans have received the electoral college vote in six of the ten contests. Obama carried Florida by less than 1% of the popular vote.
If Florida is a Republican target, Ohio is not far behind. They carried Ohio in 2000 and 2004 before Democrats carried it in the last two contests. In 2012, Obama took Ohio with a 3% margin of victory in the popular vote.
Virginia consistently was carried by the Republican candidate from 1976 through 2004. Obama carried Virginia in 2012 by a nearly 4% popular vote margin. In 2008 Obama garnered 52.6% of the vote compared with McCain’s 46.3% (6.3% margin).
Colorado is another contested state. Obama carried it in 2008 and 2012, but it has traditionally been in the Republican camp since 1976 with the sole exception of Clinton in 1992. Obama enjoyed 5.4% more popular votes than Romney and 9% more than McCain.
If Trump wins the four states that Romney did not, and holds on to North Carolina, he could win. North Carolina has cast their electoral college votes for the Republican candidate in all but two of the last ten presidential contests (1976 and 2008).
He has been covering the global capital markets in one fashion or another for more than 30 years, working at economic consulting firms and global investment banks. After 14 years as the global head of currency strategy for Brown Brothers Harriman, Chandler joined Bannockburn Global Forex, as a managing partner and chief markets strategist as of October 1, 2018.
Tags: Politics,United States


