Pater Tenebrarum
My articles My siteAbout meMy videosMy books
Follow on:TwitterSeeking AlphaFacebook
Tax Receipts vs. the Stock Market
Following the US Treasury’s update of April tax receipts, our friend Mac mailed us a few charts showing the trend in corporate tax payments. Not surprisingly, corporate tax payments and refunds mirror the many signs of a slowing economy that have recently emerged. An overview in chart form follows below. First up, corporate tax receipts in absolute figures.
Corporate Tax ReceiptsCorporate tax receipts in absolute dollars and cents – this is quite astonishing considering that the amount of money in the US economy has increased by roughly 125% since early 2008. Corporate taxes by contrast haven’t even made it back to the 2007 peak. |
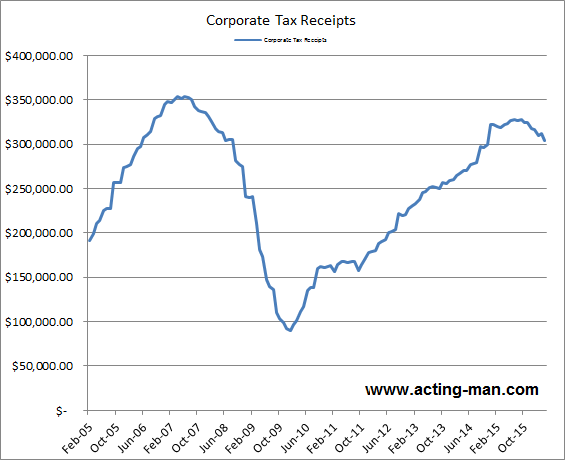 We compare Tax Receipts against the Stock Market. It becomes obvious that tax receipts have slowed down recently. And so should the performance of the stock market. - Click to enlarge |
The next chart shows tax refunds to companies – these traditionally increase when companies aren’t doing as well as they would like:
Corporate Tax RefundsCorporate tax refunds have begun to turn up – they have led the last downturn by about 7 months |
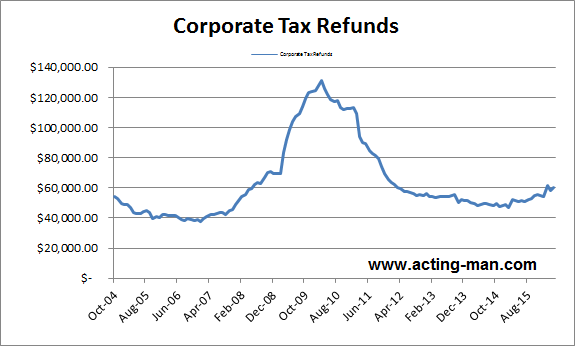 We compare Tax Receipts against the Stock Market. It becomes obvious that tax receipts have slowed down recently. And so should the performance of the stock market. - Click to enlarge |
The next chart shows the underlying trend in the form of the 12-month rolling change in net corporate tax receipts.
12 month rolling change in net corporate tax receiptsThis shows actually a quite noteworthy development: the 12 month rolling change has just crossed into negative territory to the greatest extent since late 2007 (there was a very tiny dip below the zero line in 2011 as well, during the peak of the euro area debt crisis): |
 We compare Tax Receipts against the Stock Market. It becomes obvious that tax receipts have slowed down recently. And so should the performance of the stock market. - Click to enlarge |
Mac had the interesting idea to compare gross corporate tax receipts to the S&P 500 index as well. In a way, it can be thought of as an alternative market valuation measure. As he notes to this chart:
“The market and tax receipts began to diverge at about the exact same time that QE1 began.”
Corporate tax receipts vs. the S&P 500Corporate tax receipts (red line) vs. the S&P 500 (blue line), indexed since 2005. Note the large positive gap prior to 2010 and the persistent (and now widening) negative gap since then. |
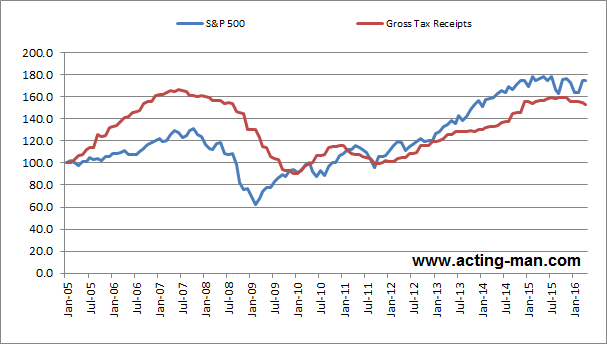 We compare Tax Receipts against the Stock Market. It becomes obvious that tax receipts have slowed down recently. And so should the performance of the stock market. - Click to enlarge |
Moving the starting point of the above comparison to January 2007 makes the diverging trends even more obvious (note that the colors have been switched in this chart):
S&P 500 (red line) vs. corporate tax receipts (blue line) – drifting apart. |
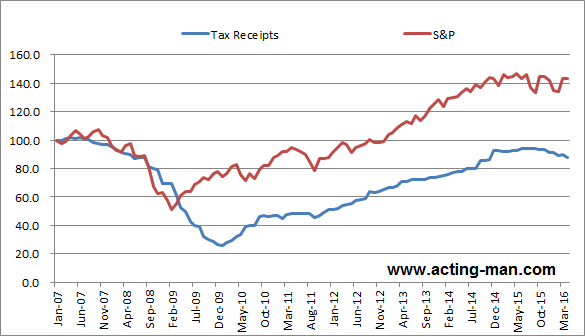 We compare Tax Receipts against the Stock Market. It becomes obvious that tax receipts have slowed down recently. And so should the performance of the stock market. - Click to enlarge |
Conclusion
Several things can be gleaned from this: 1. the economy is indeed slowing down, and corporate profits are coming under pressure (notwithstanding the non-GAAP and buyback influenced per share data reported by listed companies); 2. aggregate corporate tax receipt data are apparently a good leading indicator of economic downturns (but not of upturns, presumably because write-downs tend to lag economic recoveries); 3. the stock market’s valuation and the real economy have drifted apart quite a bit – this is nothing new of course, but it is once again confirmed by these data as well.
Charts by: Mac for acting-man.com
Full story here Are you the author?
Tags: newslettersent,On Economy,The Stock Market