The Largest Online Marketplace in the World
This company is twice the size of Enron at its peak ($100 billion). Pharmaceutical giant Valeant, which blew up in the last year, was only $90 billion at its peak. Before I get to what the stock is, let me tell you where it is: China.
The Largest Online Marketplace in the World This company is twice the size of Enron at its peak ($100 billion). Pharmaceutical giant Valeant, which blew up in the last year, was only $90 billion at its peak. Before I get to what the stock is, let m... - Click to enlarge
I recently heard an excellent presentation by Anne Stevenson-Yang at Grant’s Spring Investment conference. Stevenson-Yang is the cofounder of J Capital Research, based in Hong Kong. J Cap provides independent research on China’s stocks and its economy.
To understand China’s economy today, she said, think of Silicon Valley in 1999. You may recall that was one year before the tech bubble peaked, then collapsed. The similarities between Silicon Valley (circa 1999) and China (from about 2006 on) are striking.
In China, there’s a big emphasis on growth… but not so much on profitability. Much like the days of counting website visits (or “counting eyeballs”) instead of profits in 1999.
Capital is cheap, and the market rewards executives for raising money… but not so much for generating a profitable return on that capital. Again, a lot like 1999, when investors threw billions at anything with a “dot-com” in its name.
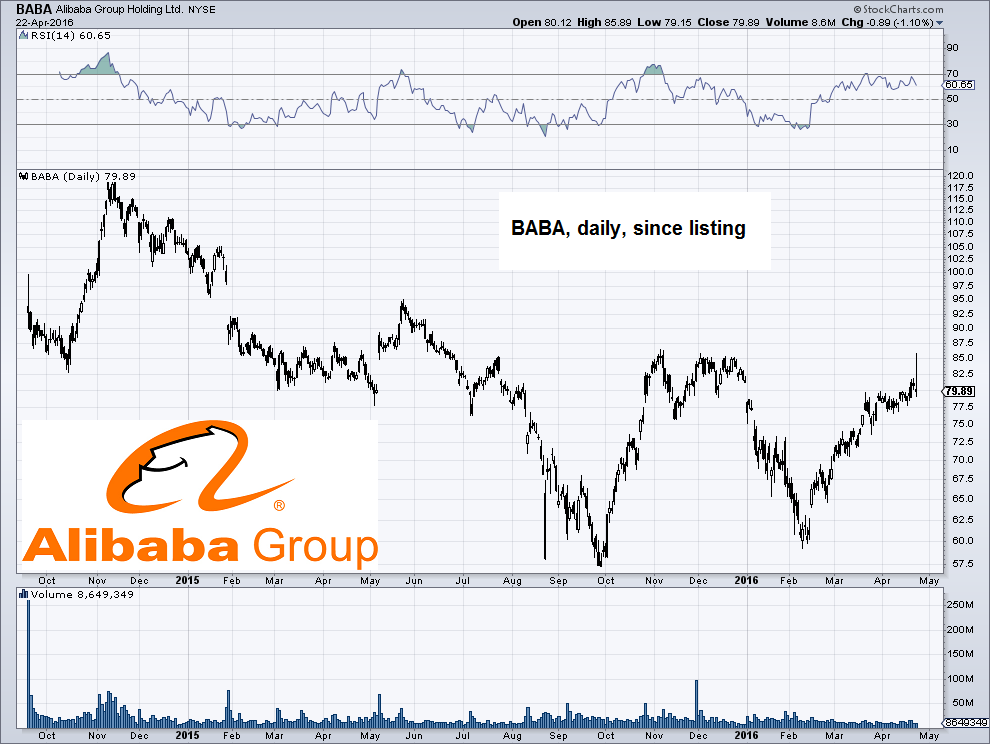
Alibaba Group (BABA) since its late 2014 NYSE listing.For Stevenson-Yang, the “poster child” of this Silicon Valley-like China is Alibaba (BABA). Alibaba trades for about $80 per share. She thinks it is worth closer to $36 per share. |
Where Does the Money Go?
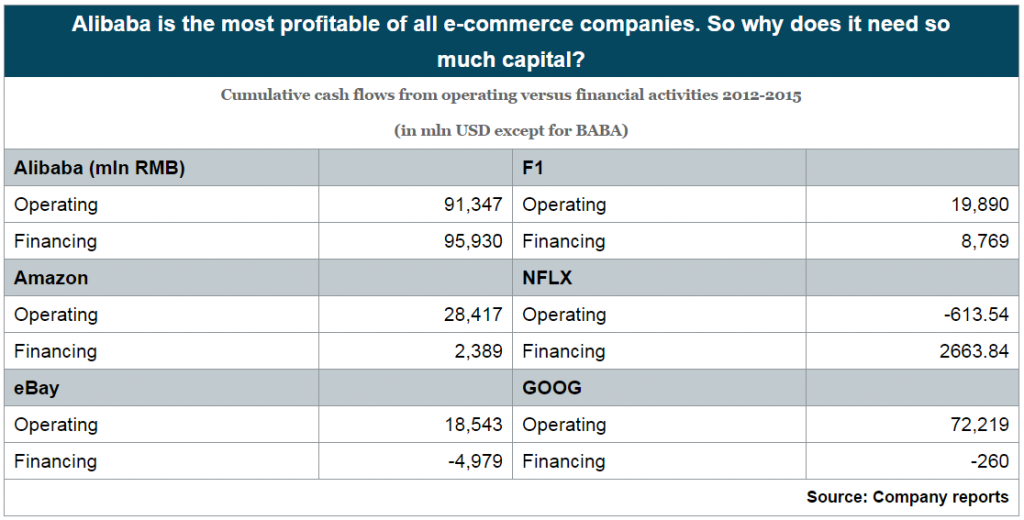
Alibaba is the eBay of China. At $200 billion, it’s the largest online marketplace in the world. But there are a number of red flags, as Stevenson-Yang pointed out. One of them is put succinctly in one of her slides:
E-commerce companies compared – operating and financing cash flows.This table shows you operating and financing cash flows of various e-commerce giants. All of them generate a lot of operating cash flow (except for Netflix). This means they don’t have to rely on financing cash flows (like borrowing money or selling stock). |
The one outlier is Alibaba. It generates a lot of operating cash. And yet, it still raises a similar amount of cash through financing activities. Why? And where does all the money go?
Partly, the cash goes towards Alibaba’s rapidly growing pile of “dubious assets.” These include goodwill, intangible assets, and investments in equity investees. These assets produce no profits or sales for Alibaba. Often, these assets can be a source of future write-downs (losses).
Take a look at this: centre FY 2012 and FY 2013 below (per FY 2014 and FY 2015)
| Alibaba’s Dubious Assets | |||||
| (RMB mln) | FY 2012 | FY 2013 | FY 2014 | FY 2015 | As of Dec. 31, 2015 |
| Investment in equity investees |
1,642 | 1,555 | 17,666 | 33,877 | 79,235 |
| Intangible assets | 355 | 334 | 1,906 | 6,575 | 5,980 |
| Goodwill | 11,436 | 11,294 | 11,793 | 41,933 | 81,645 |
| Total | 13,433 | 13,183 | 31,365 | 82,385 | 166,860 |
| Source: Company reports | |||||
Alibaba’s Dubious Assets.The original Ali Baba from the story in 1001 Nights was the head of a gang of thieves. Their assets filled a cave and were reportedly not dubious at all, only their provenance was. It seems to be the other way around with this incarnation.
|
Who Gets What – Shareholders Left in the Cold
What blows me away is how much these assets have grown – about 11.5 times since 2012. If that isn’t enough, there is more. You have to wonder who gets the lion’s share of the profits. Hint: It isn’t shareholders.
In 2015, share-based compensation was about 16% of sales and 35% of profits. That’s extraordinary. “Even as revenue rose 45% in FY [fiscal year] 2015,” Stevenson-Yang said, “income from operations declined by 7% due primarily to a significant increase in share-based compensation expense.”
Certainly, the executives are doing quite well. These are enough to keep me away, but Stevenson-Yang went deeper. She questioned the integrity of Alibaba’s figures. Consider Alibaba’s “gross merchandise value,” or GMV. It tells you the value of the merchandise bought and sold on its platform.
If you are Alibaba, you want to report a rising GMV. It shows that your network is gaining in popularity and scale. Alibaba reported a 46% growth rate in 2015. And for the first quarter of 2016, it hit a new record and grew 23% over 2015.
But perhaps the GMV figure is not all it’s cracked up to be at Alibaba. The clue may lie in the average take rate. The average take rate is the percentage the e-platform takes of each transaction. For eBay, this is about 10.5% of GMV. Yet, Alibaba, which enjoys near monopoly status, reports only a 3% take rate.
The bulls say this means there is room for BABA to increase its take rate. But realistically, the low take rate “is probably a function of overstated GMV,” Stevenson-Yang said. She’s not the only one to question Alibaba’s GMV, which has come under suspicion before.
There are many ways for Alibaba to report a misleading GMV. It could count uncompleted or returned orders. It could count balance transfers, free-of-charge transactions, and a long list of other things in GMV. It could also simply make up fake orders.
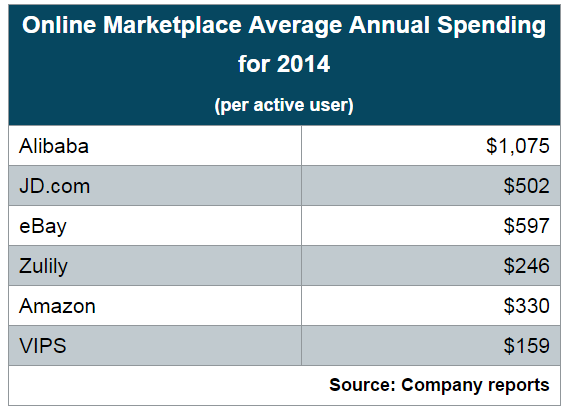
Beyond this, Stevenson-Yang had some good points on the believability of the Alibaba story. If you look at the average spend per user, you see some unusual results.
Here is another table from Stevenson-Yang comparing Alibaba to other online marketplaces:
| Online Marketplace Average Annual Spending for 2014 (per active user) |
|
| Alibaba | $1,075 |
| JD.com | $502 |
| eBay | $597 |
| Zulily | $246 |
| Amazon | $330 |
| VIPS | $159 |
| Source: Company reports | |
Online Marketplace Average Annual Spending for 2014.Online marketplaces: average annual spending per user compared. Alibaba seems to have the most expensive customers on the planet, so to speak. |
What sticks out to you? Alibaba’s average spend per user is more than double the next highest on the list, eBay. And, as Stevenson-Yang points out, the $1,075 figure is about one-third of annual disposable income in China. “It’s just really unlikely,” she says of Alibaba’s reported figure.
By now, the evidence seems overwhelming: Alibaba is not what it seems. At some point, this story will come unglued. As to when, Stevenson-Yang had an idea. Watch those capital flows. Alibaba sells stock, issues debt, and borrows from merchants. It depends on those inflows to keep the game going.
Soon, Alibaba will try to sell (via an IPO) an affiliate called Ant Financial and eventually another one called China Smart Logistics.
“If it cannot get these fundraises out,” she says, “the coast will be clear to short [or bet against Alibaba].”
The Canary
Lastly, one more telling detail from Stevenson-Yang: No Chinese banks are involved in the IPOs, bonds, or credit facilities of Alibaba. Take from that what you will.
There are other hyped-up “new economy” stocks in China – like BYD Company, an electric vehicle maker trading on the Hong Kong stock exchange. Forbes recently noted that BYD, like other companies in the new Chinese economy, is trading at price-to-earnings multiples in the hundreds.
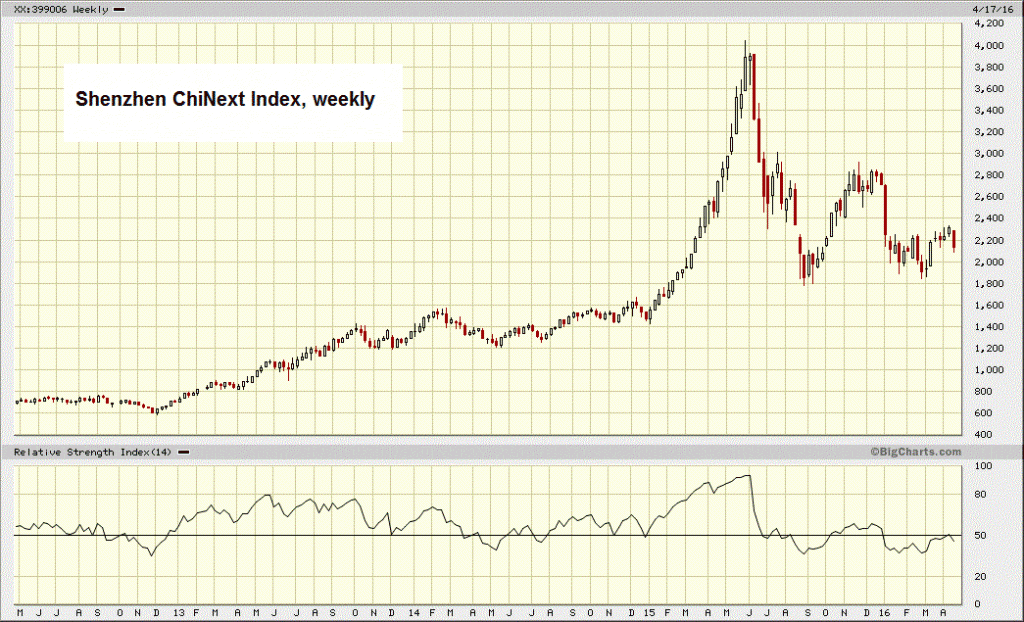
Alibaba is unique because of its size and its U.S. listing. A meltdown in Alibaba shares could drive down the prices of China’s other “new economy” stocks as well. Even though the ChiNext (akin to the tech-heavy NASDAQ) is down 21% this year, there is more room to fall.
Shenzhen ChiNext Index, weekly– not a particularly encouraging chart. Burst bubbles will often return to their point of origin – click to enlarge. |
The timing is always hard to predict. Fuzzy accounting and a good story can keep a stock afloat for years, as they did for both Enron and Valeant. My guess is Stevenson-Yang is right: If and when Alibaba’s fundraises stall, that’s your “canary in the coal mine.”
As for China in general, I like going there. I enjoy the food. I like walking around old Beijing. I like strolling along the Bund in Shanghai. I like staying at the elegant Peninsula Hong Kong overlooking Victoria Bay.
But investing in China, as anywhere else, requires careful diligence. Don’t buy into a hyped-up story about growth. The Silicon Valley investors circa 1999 did.. to their regret.
Charts by: StockCharts, BigCharts, tables by: Anne Stevenson-Yang
Chart and image captions by PT
The above article originally appeared at the Diary of a Rogue Economist, written for Bonner & Partners. Bill Bonner founded Agora, Inc in 1978. It has since grown into one of the largest independent newsletter publishing companies in the world. He has also written three New York Times bestselling books, Financial Reckoning Day, Empire of Debt and Mobs, Messiahs and Markets.
Full story here Are you the author? Previous post See more for Next post
Tags: newslettersent,On Economy,The Stock Market


