Investors and policymakers continue to wrestle with the economic impact of the dollar's rise. The Federal Reserve has argued that the dollar's appreciation acts as a headwind on exports and dampens imported inflation. At the same time, despite the dollar's appreciation and the fall in oil prices, core inflation rose steadily last year.
Core CPI rose from 1.6% at the end of 2014 to 2.1% at the end of 2015. The core PCE deflator lagged, but the after bottoming last July below 1.26%, it finished the year near 1.41%.
Fed officials have a nuanced understanding of the dollar. On one hand, the share of exports in the US economy are less than half of Germany's for example, and much of what the US imports is invoiced in dollars, the greenback's exchange rate is not often a particularly important variable in the policy-making equation.
However, when there is a sharp dollar move, it becomes more salient. Since mid-2014, the nominal trade-weighted dollar index that the Federal Reserve tracks by nearly a quarter through the end of last month. Adjusted for inflation, the dollar's appreciation was a little less than 20%.
On the other hand, Fed officials argue that impact of the dollar's rise is transitory. By that, officials direct investors' attention to the rate of change. The economic is largely driven by the pace of change, not the level. The level may not be transitory, but the rate of change is unlikely to be sustained.
That means the impact on prices and exports will moderate in time. For example, in the nine-month stretch from mid-2014 through Q1 2015, the nominal trade-weighted dollar appreciated by 19%. The impact may still linger then in Q1 16, but then it should fade. Since last March, the dollar has risen almost 5.5%, which is not nearly as riveting.
Part of the challenge for investors is that the Federal Reserve's trade-weighted measures of the dollar are updated monthly. However, there is a real-time measure that is nearly as good. It is the Bank of England's measure of a nominal trade-weighted dollar index.
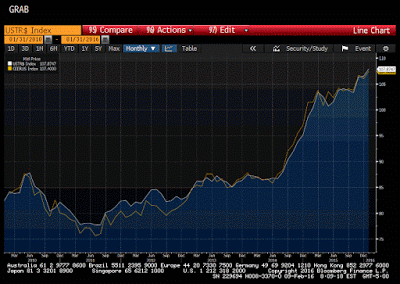
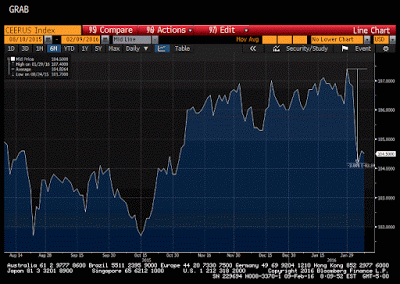
The Great Graphic here shows how closely the BOE's measure tracks the Federal Reserve's nominal trade-weighted dollar index. The Fed's measure is the white line. The BOE's measure is the yellow line. Now that the tight fit has been established, we can see what the BOE's measure has done since the start of the month. That is what this second chart shows.
The BOE's nominal trade-weighted dollar index has fallen 3% since the end of January. This brings the index back to levels since in early November, before the run-up that was seen ahead of the anticipated Fed hike in December and the anticipated easing by the ECB.
There what is happening. Look at the top five US trading partners. The dollar remains near record highs against the Mexican peso, which is off nearly 4% since the end of last month. This is the negative emerging market sentiment and partly a function of the inability of oil to carve out a convincing low. Fr all practical purposes, it is flat against the Chinese yuan.
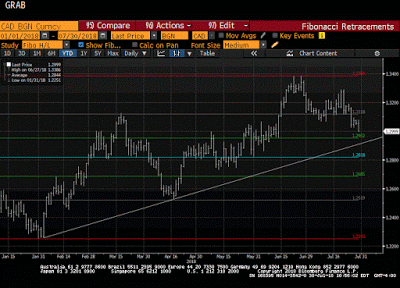
Despite the heaviness of oil prices, the Canadian dollar is slightly firmer now compared at the end of January. However, the currencies of the other two main trading partners have seen their currencies rise more significantly. The yen has gained 5.8% since the end of January, and the euro has risen 4.25%.
Of course, the March FOMC meeting is still more than a month away. However, it appears that the movement of the decline of the trade-weighted dollar may reduce its salience in the Fed's decision-making. The dollar's appreciation was also an input into financial condition models that point to a tightening of conditions. The dollar's contribution to this is less so now.
Tags: Great Graphic


